This site uses cookies. By continuing to browse the ConceptDraw site you are agreeing to our Use of Site Cookies.

Bubble diagrams in Landscape Design with ConceptDraw DIAGRAM

To define the links between the different areas of your own landscape design and see the project from aside, we recommend to draw landscape diagram called bubble one which is analogue of «mind maps» as it allows us to create approximate image of our future proper landscape view. Use special libraries (and we have plenty of them) with objects of landscape design to be able to create the detailed plan of your landscape which will be looking so smart and professionally good as the samples we provide were created by designers who know so much about making such kinds of design plans. Having ConceptDraw DIAGRAM as the assistant in your work, will ensure the success after using our product. Make the bubble diagrams as well as any other ones in minutes with ease having our application called ConceptDraw DIAGRAM and you will see how quick it will change your life simplifying lots of work.

bubble chart, bubble chart creator, bubble diagram Bubble Diagrams

bubble chart, bubble chart creator, bubble diagram
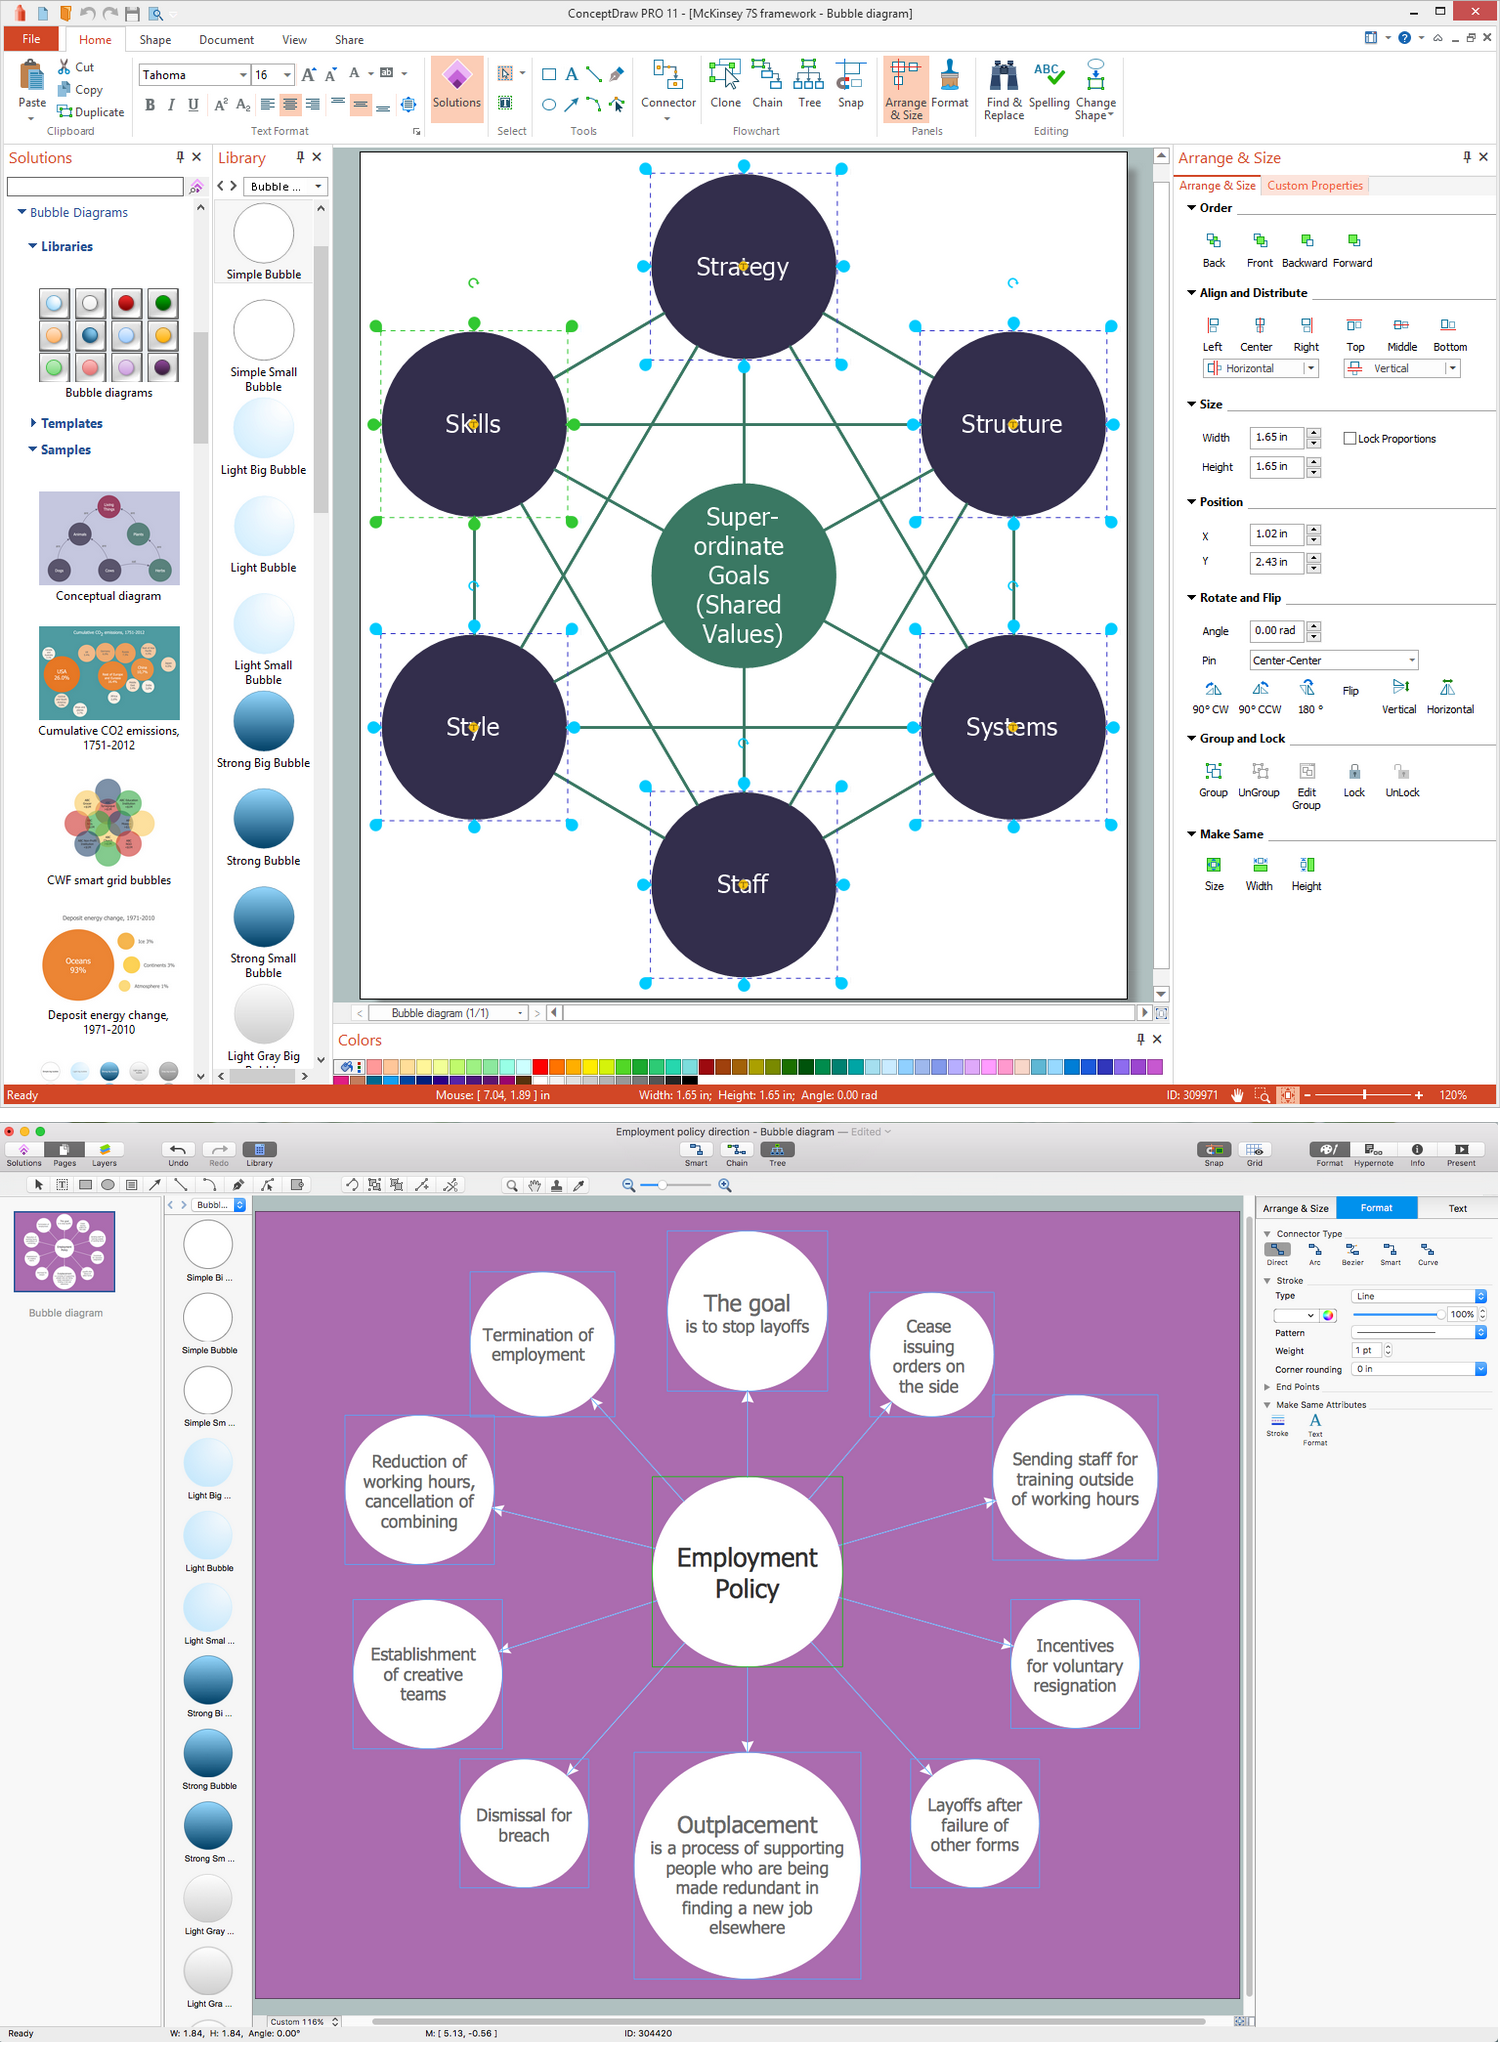
Bubble diagrams have enjoyed great success in software engineering, architecture, economics, medicine, landscape design, scientific and educational process, for ideas organization during brainstorming, for making business illustrations, presentations, planning, design, and strategy development. They are popular because of their simplicity and their powerful visual communication attributes.

draw picture graph, draw picture chart, image chart, pictorial chart Picture Graphs

draw picture graph, draw picture chart, image chart, pictorial chart
Typically, a Picture Graph has very broad usage. They many times used successfully in marketing, management, and manufacturing. The Picture Graphs Solution extends the capabilities of ConceptDraw DIAGRAM with templates, samples, and a library of professionally developed vector stencils for designing Picture Graphs.

ConceptDraw Solution Park ConceptDraw Solution Park

ConceptDraw Solution Park
ConceptDraw Solution Park collects graphic extensions, examples and learning materials
HelpDesk

How to Create a Bubble Diagram

Bubble Diagram is a simple chart that consists of circles (bubbles) repesening certain topics or processes. Bubbles are connected by lines depicting the type of relationships between the bubbles. The size of each bubble is depended on the importance of the entity it represents. Bubble charts are widely used throughout social, economical, medical, and other scientific researches as well as throughout architecture and business management. Bubble charts are often used during the early stages of product development to visualize thoughts and ideas for the purpose of sketching out a development plan. ConceptDraw DIAGRAM allows you to draw a bubble diagrams using the Bubble Diagrams solution.
HelpDesk

How to Add a Bubble Diagram to PowerPoint Presentation

Bubble diagrams can be used to compare concepts and identify areas of similarity and difference. ConceptDraw DIAGRAM allows you to make an MS PowerPoint Presentation from your charts in a few simple steps. A bubble diagram is a chart that represents information visually in the form of a series of bubbles. Bubble charts are often used in marketing and management during the early stages of product development to visualize ideas and concepts by organizing them in a hierarchy. The ability to create this form of a diagram is contained within the Bubble Diagrams solution. A PowerPoint presentation of bubble diagrams can be used to demonstrate and identify areas of similarity and difference of featured business ideas and concepts.

Bubble diagrams with ConceptDraw DIAGRAM

Using ConceptDraw you will be able to create bubble diagrams from the ready ConceptDraw library objects or make your own objects. The created diagram can be saved and edited, objects can be moved and links between them will be automatically repainted after object moving because of using the ConceptDraw connectors.
HelpDesk

How to Add a Bubble Diagram to MS Word

A bubble diagram is used the same purpose as a scatter diagram, but in the case, if the data has three dimensions, each of that containing the set of values. A bubble chart is a diagram in which the data points are replaced with bubbles, and the size of the bubbles represents some additional dimension of the data. A bubble chart does not have the axis. The sizes of the bubbles are determined by the values in the third dimension. Any additional information about the entities beyond their three primary dimensions can be depicted by rendering bubbles in colors and patterns that are selected in a certain way. The legend containing the further information can be added to a bubble diagram. ConceptDraw DIAGRAM allows you to easily create various business management and marketing charts, including bubble diagrams and then add them to an MS Word document.
HelpDesk

How To Create Visio Bubble Chart

ConceptDraw DIAGRAM allows you to easily create business charts and diagrams of any complexity, including the bubbles diagram and then make an MS Visio file from your diagram in a few simple steps.

illustration software, astronomy pictures, astronomy symbols, sketching software   Astronomy

illustration software, astronomy pictures, astronomy symbols, sketching software
Astronomy solution extends ConceptDraw DIAGRAM software with illustration and sketching software with templates, samples and libraries of a variety of astronomy symbols, including constellations, galaxies, stars, and planet vector shapes; a whole host of cele

Best Diagramming Software for macOS

ConceptDraw DIAGRAM creates drawings, flowcharts, block diagrams, bar charts, histograms, pie charts, divided bar diagrams, line graphs, area charts, scatter plots, circular arrows diagrams, Venn diagrams, bubble diagrams with great visual appeal on Mac OS X.
How to Draw a Bubble Chart
HelpDesk

How to Create a Picture Graph

Picture Graphs are used commonly to represent non-complex data to a large audience. A Picture Graph is a simple kind of marketing diagram used to show the relationship among various quantities. It includes pictures or symbols to represent information visually. There are many cases when you have just some numbers to show and compare. This is not a reason to not use visual tools. You can produce a simple picture graph using memorable symbols to get the best visual presentation. Using specific symbols instead of regular colored bars makes picture graphs a much more descriptive tool. You can use tools from an existing library or find appropriate clipart in ConceptDraw’s collection. ConceptDraw DIAGRAM allows you to draw a simple and easy to understand Picture Charts using the special library.

How To Make a Bubble Chart

Bubble diagrams solution extends ConceptDraw DIAGRAM software with templates, Using ConceptDraw Connectors, you can make a bubble chart in moments. Using ConceptDraw you will be able to make a bubble chart from the ready ConceptDraw library objects or make your own objects. The created diagram can represent ideas organization, in brainstorming processes, by teachers for explaining difficult ideas or for presentations.

Bubble Chart

How to design a Bubble Chart? It’s very easy! All that you need is a powerful software. Never before creation of a Bubble Chart wasn’t so easy as now with tools of Bubble Diagrams Solution from the "Diagrams" Area for ConceptDraw Solution Park.

network topology diagram software, network icons, network diagram template, networking icons available, how to draw a network diagram Computer Network Diagrams

network topology diagram software, network icons, network diagram template, networking icons available, how to draw a network diagram
Computer Network Diagrams solution extends ConceptDraw DIAGRAM software with samples, templates and libraries of vector icons and objects of computer network devices and network components to help you create professional-looking Computer Network Diagrams, to plan simple home networks and complex computer network configurations for large buildings, to represent their schemes in a comprehensible graphical view, to document computer networks configurations, to depict the interactions between network's components, the used protocols and topologies, to represent physical and logical network structures, to compare visually different topologies and to depict their combinations, to represent in details the network structure with help of schemes, to study and analyze the network configurations, to communicate effectively to engineers, stakeholders and end-users, to track network working and troubleshoot, if necessary.

Bubble Chart Maker

ConceptDraw DIAGRAM diagramming and vector drawing software extended with Bubble Diagrams Solution from the "Diagrams" Area is a powerful Bubble Chart Maker.

football, american football, football field, american football field, football field dimensions, offense, defense, football plays, football diagram Football

football, american football, football field, american football field, football field dimensions, offense, defense, football plays, football diagram
The Football Solution extends ConceptDraw DIAGRAM software with samples, templates, and libraries of vector objects for drawing football (American) diagrams, plays schemas, and illustrations. It can be used to make professional looking documen

Bubble Charts

Bubble Charts are convenient way to visualize ideas and concepts by organizing them in a hierarchy. To show the importance of ideas you can use different bubble sizes and colors. ConceptDraw DIAGRAM diagramming and vector drawing software extended with Bubble Diagrams Solution from the "Diagrams" Area affords you the easiest and fastest way for designing professional looking Bubble Charts.