HelpDesk
How to Draw a Pictorial Chart in ConceptDraw PRO

Sample Pictorial Chart. Sample Infographics
")
How to Draw Pictorial Chart. How to Use Infograms

Pictorial Chart

Design Pictorial Infographics. Design Infographics

Basic Diagramming


Process Flowchart


The vector stencils library "Picture Graphs" contains 35 templates of picture bar graphs for visual data comparison and time series.
Drag a template from the library to your document, set bars number, type category labels, select bars and enter your data.
Use these shapes to draw your pictorial bar charts in the ConceptDraw PRO diagramming and vector drawing software.
The vector stencils library "Picture Graphs" is included in the Picture Graphs solution from the Graphs and Charts area of ConceptDraw Solution Park.
Arrow
Water drop

Food

Grain

Agriculture

Medicines

Houses

Buildings

Money bags

Oil barrels

Natural gas

Electrical power

Nuclear power

Mechanical engineering

Chemical industry

Mining

Gold bars

Coins

Person

Men, women and children

Man

Woman

Child

Milk

Meat

Fruits

Vegetables

Computer

Mobile phone

Airliner

Car

Bus

Truck

Train

Cargo ship

The vector stencils library "Picture bar graphs" contains 35 templates of pictorial charts. Use it for visualization of data comparison and time series with ConceptDraw PRO diagramming and vector drawing software.
"Pictorial bar graph.
Sometimes reffered to as a pictographs. A pictorial bar graph is a graph in which the rectangular bars have been filled with pictures, sketches, icons, etc. or where pictures, sketches, icons, etc. have been substituted for the rectangular bars. In both variations, one or more symbols might be used in each bar. The two major reasons for using pictorial graphs are to make the graph more appealing visually and to facilitate better communications." [Information Graphics: A Comprehensive Illustrated Reference. R. L. Harris. 1999. p.41]
The pictorial charts example "Design elements - Picture bar graphs" is included in the Picture Graphs solution from the Graphs and Charts area of ConceptDraw Solution Park.
Templates

 ConceptDraw Solution Park
ConceptDraw Solution Park collects graphic extensions, examples and learning materials
Basic Flowchart Symbols and Meaning


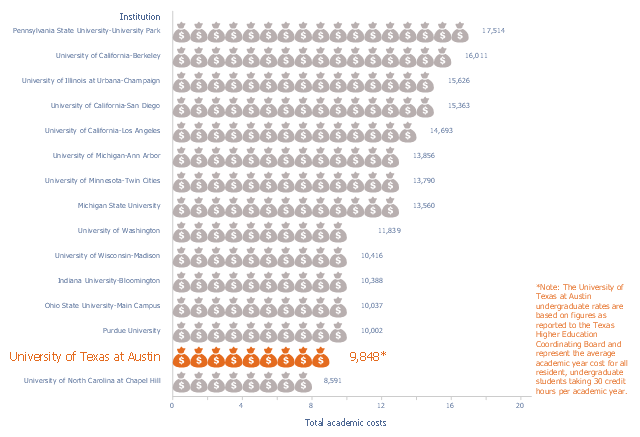
This picture bar graph sample shows the UT Austin Tuition Ranks 6th Compared to Other Texas Public Universities (Tuition and fees per semester, fall 2015). It was designed using data of the diagram "Compare UT Tuition" from the website of the University of Texas at Austin.
[tuition.utexas.edu/ compare]
The pictorial chart "Academic costs for residents, 2015-16" was created using the ConceptDraw PRO diagramming and vector drawing software extended with the Picture Graphs solution from the Graphs and Charts area of ConceptDraw Solution Park.
[tuition.utexas.edu/ compare]
The pictorial chart "Academic costs for residents, 2015-16" was created using the ConceptDraw PRO diagramming and vector drawing software extended with the Picture Graphs solution from the Graphs and Charts area of ConceptDraw Solution Park.
Pictorial chart
Infographic Software

- How to Draw a Pictorial Chart in ConceptDraw PRO | How to Draw ...
- How to Draw a Pictorial Chart in ConceptDraw PRO | Sample ...
- Picture Graphs | How to Create a Picture Graph in ConceptDraw ...
- How to Draw a Pictorial Chart in ConceptDraw PRO | Design ...
- Design Pictorial Infographics. Design Infographics | Sample Pictorial ...
- Sample Pictorial Chart . Sample Infographics | How to Draw Pictorial ...
- Sample Pictorial Chart . Sample Infographics | How to Draw a ...
- Pictorial Chart
- Sample Pictorial Chart . Sample Infographics | Design Pictorial ...
- How to Draw a Pictorial Chart in ConceptDraw PRO | Process ...
- Infographic Maker | How to Draw Pictorial Chart . How to Use ...
- How to Draw Pictorial Chart . How to Use Infograms | Sample ...
- Pictorial Chart Templates
- Pie Chart Examples and Templates | Sample Pictorial Chart . Sample ...
- How to Draw Pictorial Chart . How to Use Infograms | Process ...
- Basic Diagramming | Sample Pictorial Chart . Sample Infographics ...
- Bar Graphs | Line Graphs | Picture Graphs | Graphs
- World Population Infographics | Sample Pictorial Chart . Sample ...
- Design Pictorial Infographics. Design Infographics | How to Draw ...
- World Population Infographics | Sample Pictorial Chart Sample ...