This picture bar graph sample shows the computer and Internet use at home from 1984 to 2014. It was designed using data from website of the United States Census Bureau (USCB).
[census.gov/ content/ dam/ Census/ library/ visualizations/ 2016/ comm/ digital_ nation.png]
"Home automation is the residential extension of building automation and involves the control and automation of lighting, heating, ventilation, air conditioning (HVAC), appliances, and security. Modern systems generally consist of switches and sensors connected to a central hub sometimes called a "gateway" from which the system is controlled with a user interface that is interacted either with a wall-mounted terminal, mobile phone software, tablet computer or a web interface." [Home automation. Wikipedia]
The pictorial chart example "Computer and Internet use at home over time" was created using the ConceptDraw PRO diagramming and vector drawing software extended with the Picture Graphs solution from the Graphs and Charts area of ConceptDraw Solution Park.
Image chart

How to Draw Pictorial Chart. How to Use Infograms

Network Diagramming Software for Design Computer and Network Diagrams
_Win_Mac.png "Network Diagramming Software, Design Elements — Computer and Network (Windows, Macintosh)")

Local area network (LAN). Computer and Network Examples
. Computer and Network Examples")
Design Pictorial Infographics. Design Infographics

Pictorial Chart

Basic Flowchart Symbols and Meaning


The vector stencils library "Computer pictograms" contains 20 icons of computer symbols. Use it to draw your pictorial infographics. The example "Computer pictograms - Vector stencils library" was created using the ConceptDraw PRO diagramming and vector drawing software extended with the Pictorial infographics solution from the area "What is infographics" in ConceptDraw Solution Park.
Computer

Laptop computer

Sleep mode

Custom

Refresh

Remove

Add

Cancel

Accept

Fullscreen

Exchange

Log off

Setting

Cursor

Computer keyboard

Computer mouse

Media

File

Directory

Floppy disk

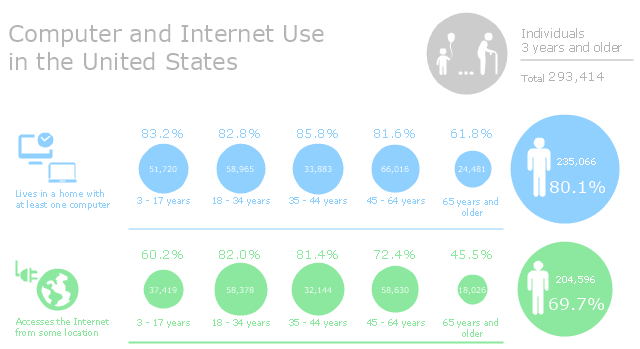
This infographic sample was created on the base of "Computer and Internet Use in the United States. Population Characteristics. Thom File. Issued May 2013." from the website of U.S. Census Bureau (U.S. Department of Commerce. Economics and Statistics Administration). [census.gov/ prod/ 2013pubs/ p20-569.pdf]
The infogram example "Computer and Internet Use in the United States" was created using the ConceptDraw PRO diagramming and vector drawing software extended with the Pictorial Infographic solition from the area "What is infographics" in ConceptDraw Solution Park.
The infogram example "Computer and Internet Use in the United States" was created using the ConceptDraw PRO diagramming and vector drawing software extended with the Pictorial Infographic solition from the area "What is infographics" in ConceptDraw Solution Park.
Pictorial infogram
The vector stencils library "Picture Graphs" contains 35 templates of picture bar graphs for visual data comparison and time series.
Drag a template from the library to your document, set bars number, type category labels, select bars and enter your data.
Use these shapes to draw your pictorial bar charts in the ConceptDraw PRO diagramming and vector drawing software.
The vector stencils library "Picture Graphs" is included in the Picture Graphs solution from the Graphs and Charts area of ConceptDraw Solution Park.
Arrow
Water drop

Food

Grain

Agriculture

Medicines

Houses

Buildings

Money bags

Oil barrels

Natural gas

Electrical power

Nuclear power

Mechanical engineering

Chemical industry

Mining

Gold bars

Coins

Person

Men, women and children

Man

Woman

Child

Milk

Meat

Fruits

Vegetables

Computer

Mobile phone

Airliner

Car

Bus

Truck

Train

Cargo ship

 Computer Network Diagrams
Computer Network Diagrams solution extends ConceptDraw PRO software with samples, templates and libraries of vector icons and objects of computer network devices and network components to help you create professional-looking Computer Network Diagrams, to plan simple home networks and complex computer network configurations for large buildings, to represent their schemes in a comprehensible graphical view, to document computer networks configurations, to depict the interactions between network's components, the used protocols and topologies, to represent physical and logical network structures, to compare visually different topologies and to depict their combinations, to represent in details the network structure with help of schemes, to study and analyze the network configurations, to communicate effectively to engineers, stakeholders and end-users, to track network working and troubleshoot, if necessary.
Mesh Network Topology Diagram

Process Flowchart


Storage area networks (SAN). Computer and Network Examples
. Computer and Network Examples")
- Internet Logos Png
- Computer and Internet use at home over time | Personal area (PAN ...
- How to Draw Pictorial Chart. How to Use Infograms | Process ...
- Logo Mouse Pc Png
- Pictorial Symbol Of A Computer Mouse
- Logo Mobile Phone Png
- Computer pictograms - Vector stencils library | Computer peripheral ...
- Computer Pictorial Chart
- Computer and Internet use at home over time | Home area networks ...
- Tower Server Pictorial Png
- Shopping pictograms - Vector stencils library | Shopping pictograms ...
- Pyramid diagrams - Vector stencils library | Directional Maps ...
- 2d Plane Png
- World Continents Map | Geo Map - USA - Wisconsin | The Globe As ...
- Logo Truck Png
- Computer pictograms - Vector stencils library | Design elements ...
- Computer Logo Vector
- Professions - Vector stencils library | Metropolitan area networks ...
- 3D pictorial street map | Components of ER Diagram | Network ...
- Internet Connectivity. Computer and Network Examples | Internet ...