How to Draw Pictorial Chart. How to Use Infograms

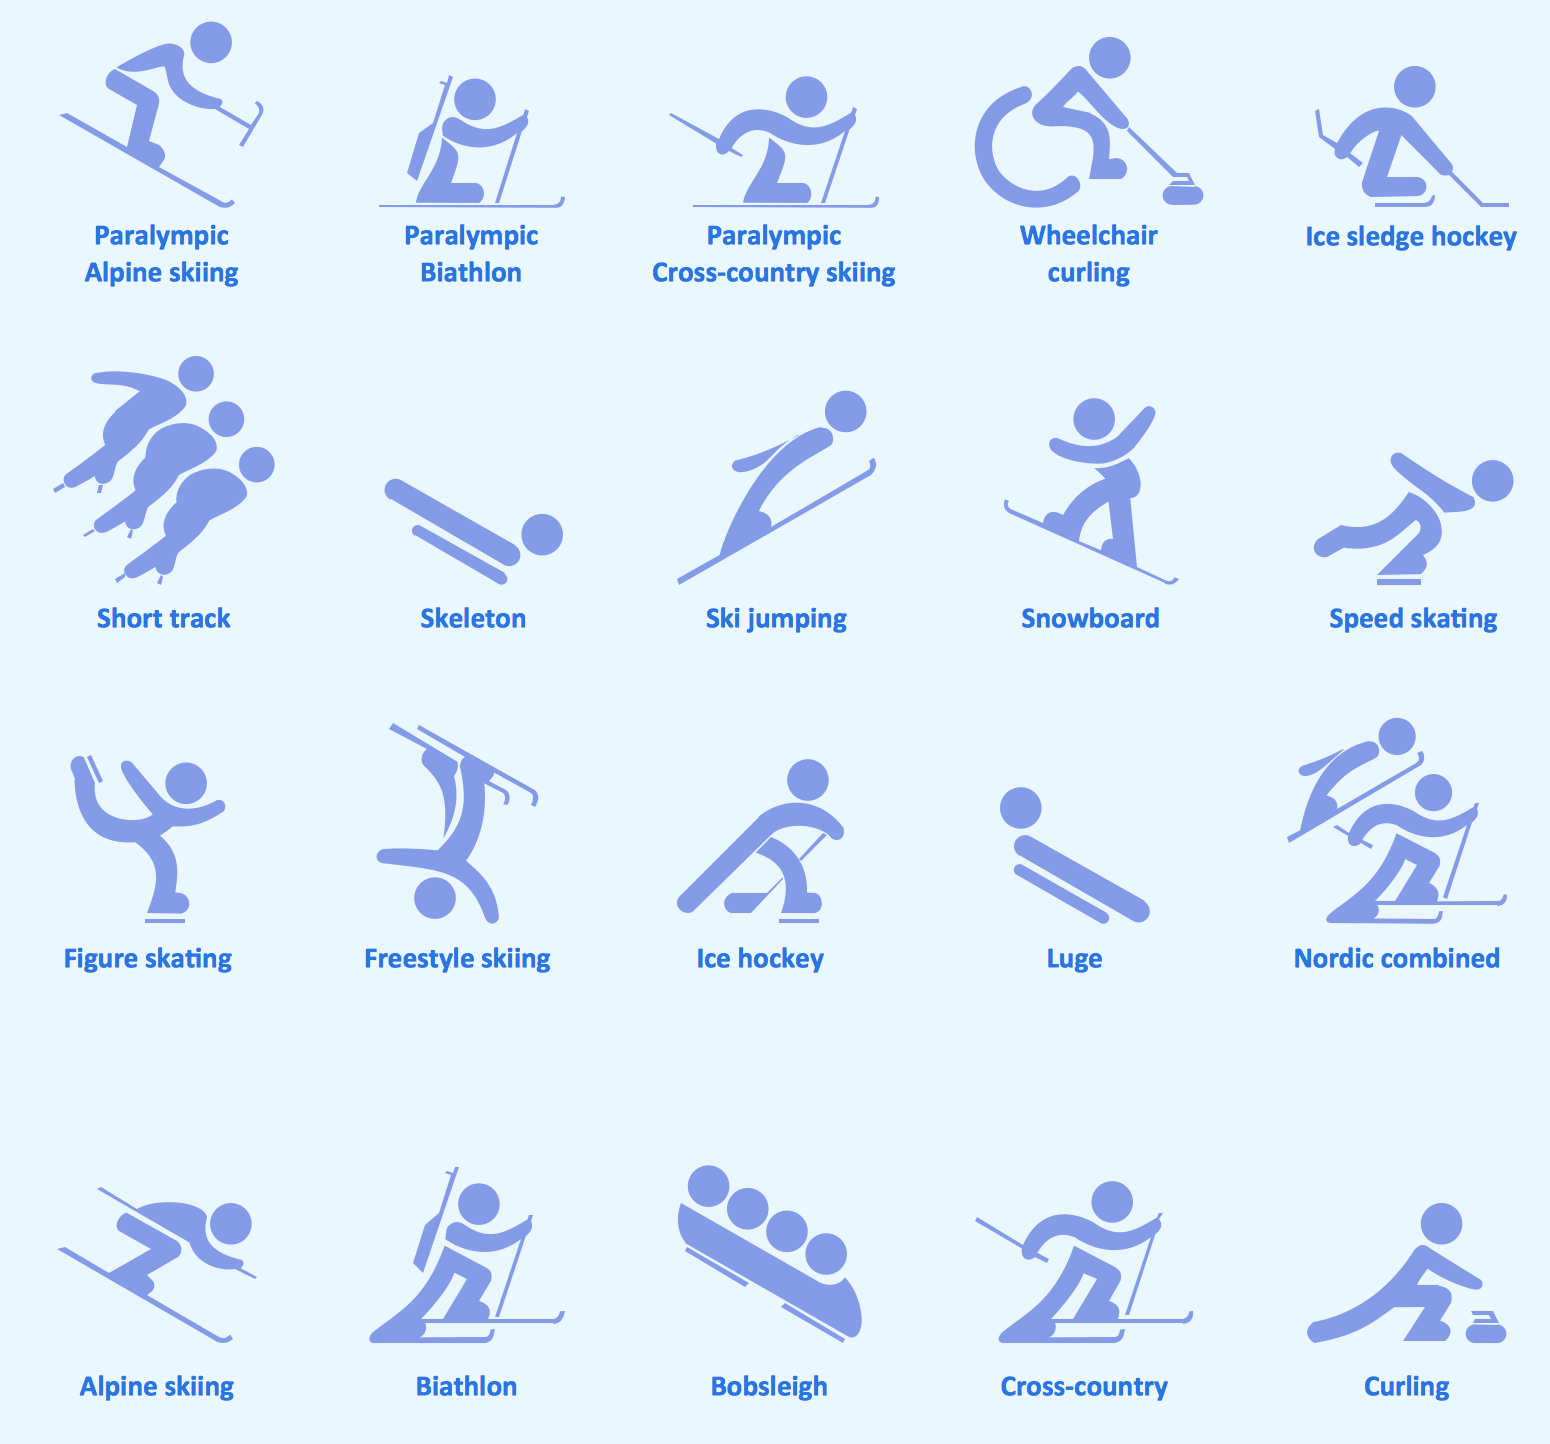
Sport pictograms. Olympic Games
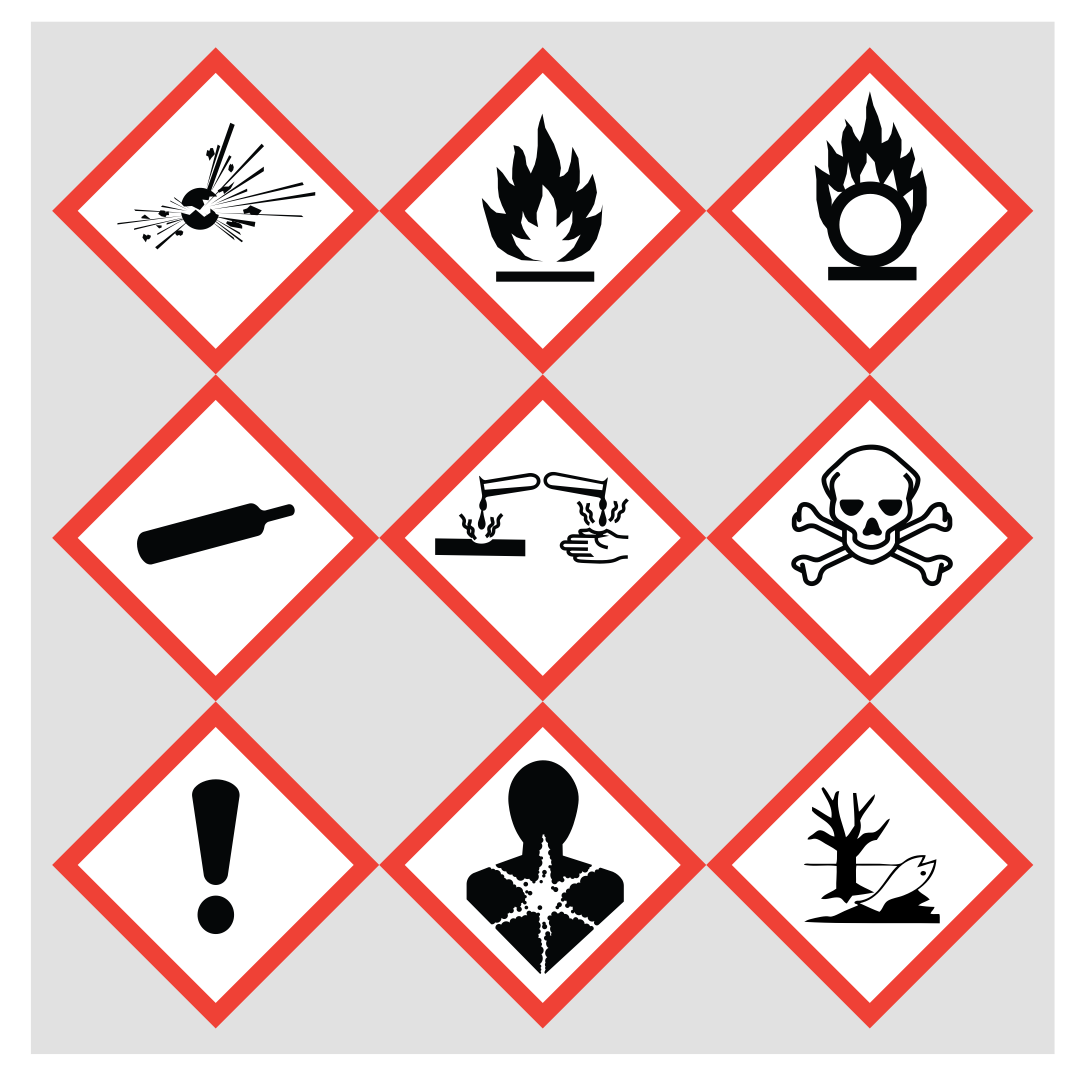
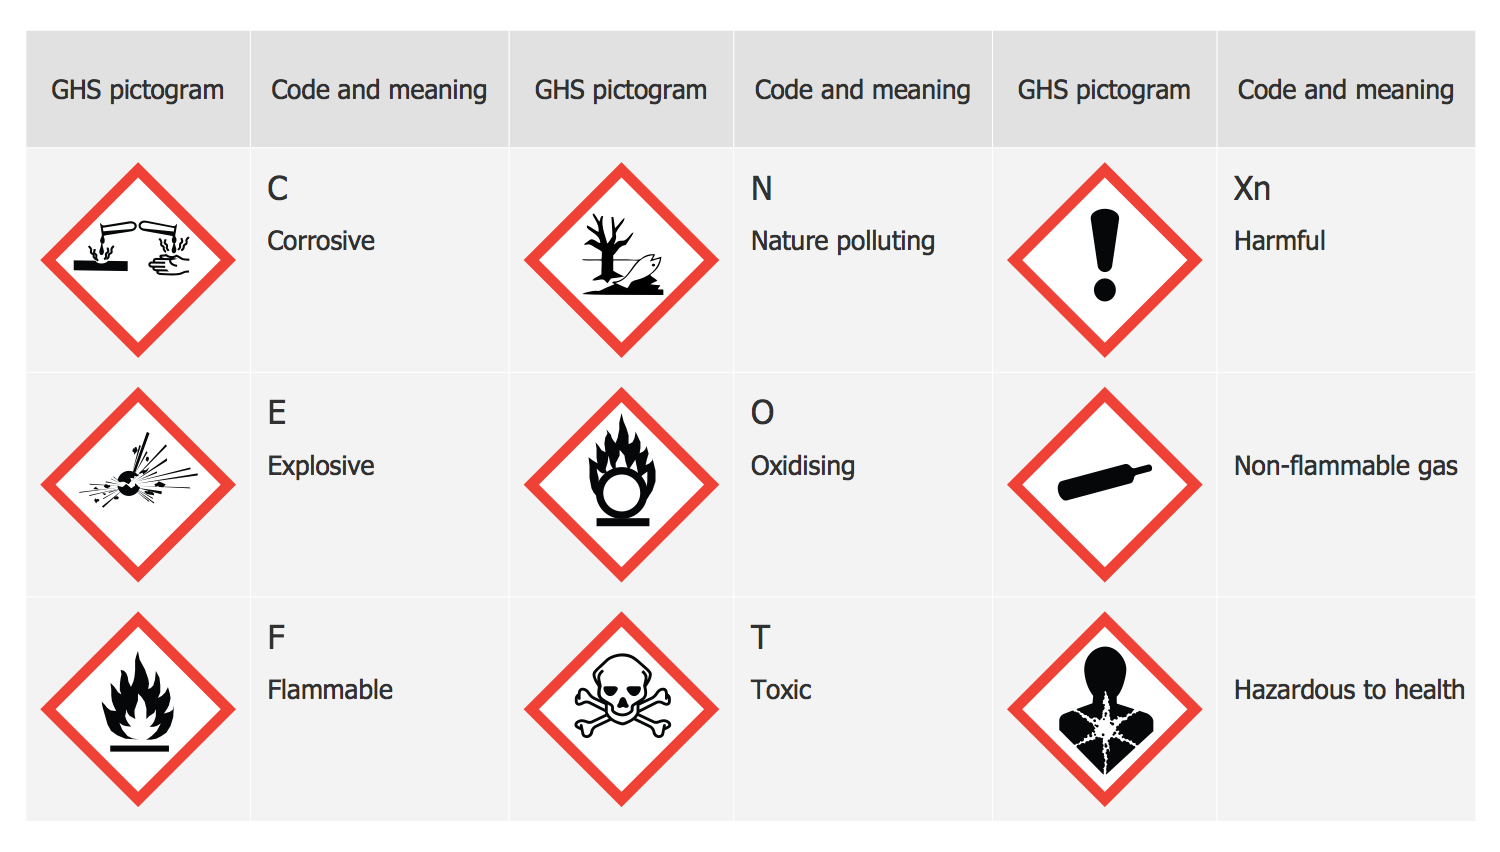
 GHS Hazard Pictograms
GHS Hazard Pictograms solution contains the set of predesigned standard GHS pictograms, Hazardous symbols, and Hazard communication pictograms, approved and agreed by UN in Globally Harmonized System of Classification and Labelling of Chemicals (GHS). They can be used for quick and simple designing accurate and professional-looking infographics, diagrams, warning announcements, signboards, posters, precautionary declarations, regulatory documents, and for representing the main items of OSHA HAZCOM Standard.
Winter Sports Vector Clipart. Medal Map. Spatial Infographics

HelpDesk
How To Design Regulatory Documents with use of Standard GHS Pictograms

OSHA HAZCOM pictograms
 Social Media Response
This solution extends ConceptDraw DIAGRAM and ConceptDraw MINDMAP with the ability to draw interactive flow charts with action mind map templates, to help create an effective response to applicable social media mentions.
HR Flowchart Symbols

GHS Label Pictograms
Design Pictorial Infographics. Design Infographics

- Management pictograms - Vector stencils library | How To Make a ...
- Travel Infographics | Design elements - Travel and tourism ...
- Rotating equipment - Vector stencils lybrary | Education pictograms ...
- Ecology pictograms - Vector stencils library | Design elements ...
- Transport Hazard Pictograms | FTA diagram - Hazard analysis ...
- Management Consultant | Business people pictograms - Vector ...
- Speed skating - Winter sports pictograms | Winter sports pictograms ...
- Pictogram
- Transport Hazard Pictograms | Pyramid Diagram | Competitor ...