Hybrid Network Topology

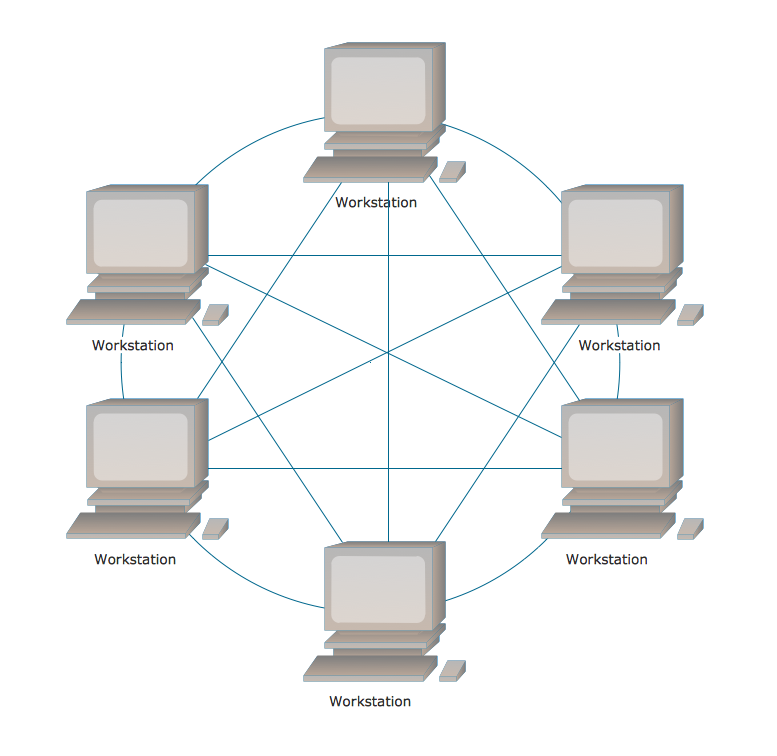
Fully Connected Network Topology Diagram
Cross-Functional Flowchart


Pyramid Diagram

ERD Symbols and Meanings


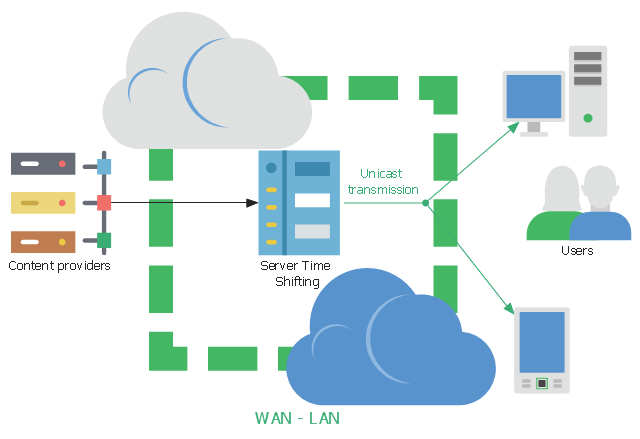
This network diagram sample shows the video on demand (VoD) architecture in a network video recorder (NVR) enviroment. It was designed on the base of Wikimedia Commons file: BaixdemandaArchitecture.png.
[commons.wikimedia.org/ wiki/ File:BaixdemandaArchitecture.png]
This file is licensed under the Creative Commons Attribution-Share Alike 3.0 Unported license. [creativecommons.org/ licenses/ by-sa/ 3.0/ deed.en]
"Video on demand (display) (VOD) are systems which allow users to select and watch/ listen to video or audio content when they choose to, rather than having to watch at a specific broadcast time. IPTV technology is often used to bring video on demand to televisions and personal computers." [Video on demand. Wikipedia]
The network diagram example "VoD architecture in a NVR enviroment" was created using the ConceptDraw PRO diagramming and vector drawing software extended with the Computers and
Communications solution from the Illustration area of ConceptDraw Solution Park.
Network diagram
Social Media Flowchart Symbols

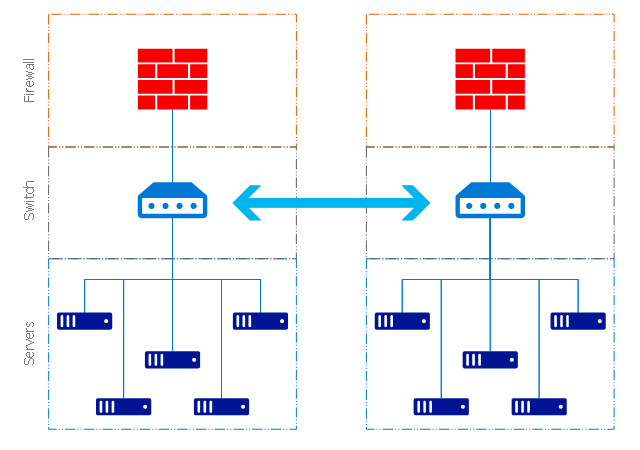
This example of cloud computing system architecture diagram was redesigned from the Wikimedia Commons file: ArchitectureCloudLinksSameSite.png. [commons.wikimedia.org/ wiki/ File:ArchitectureCloudLinksSameSite.png]
"An example showing a grid computing system connecting many personal computers over the Internet using inter-process network communication ...
In computer science, inter-process communication (IPC) is the activity of sharing data across multiple and commonly specialized processes using communication protocols. Typically, applications using IPC are categorized as clients and servers, where the client requests data and the server responds to client requests." [en.wikipedia.org/ wiki/ Inter-process_ communication]
"Grid computing is the collection of computer resources from multiple locations to reach a common goal. The grid can be thought of as a distributed system with non-interactive workloads that involve a large number of files. Grid computing is distinguished from conventional high performance computing systems such as cluster computing in that grid computers have each node set to perform a different task/ application. Grid computers also tend to be more heterogeneous and geographically dispersed (thus not physically coupled) than cluster computers." [Grid computing. Wikipedia]
The diagram example "Grid computing system architecture" was created using ConceptDraw PRO diagramming and vector drawing software extended with the Azure Architecture solution from the Computer and Networks area of ConceptDraw Solution Park.
Grid computing system architecture diagram
Program Structure Diagram

Electrical Symbols — Transmission Paths
- Advantage And Disadvantage Personal Area Network
- | Man Network Wiki
- Enterprise private network | Epn Network Wikipedia
- High Speed Networks Wikipedia
- Metropolitan area networks (MAN). Computer and Network Examples
- Home network plan | Call shop solution | Han Network Wikipedia
- Wireless Networks | Telecommunication Network Diagrams ...
- Personal Area Network Illustration
- Firewall between LAN and WAN | Computer network diagram ...
- Satellite Networks In Computer Network In Wikipedia