This site uses cookies. By continuing to browse the ConceptDraw site you are agreeing to our Use of Site Cookies.

Design Pictorial Infographics. Design Infographics

In the course of recent decades data visualization went through significant development and has become an indispensable tool of journalism, business intelligence and science. The way visual information may be conveyed is not limited simply to static or dynamic representation, it can also be interactive. Infographics can be conditionally divided into several general levels. Primarily, this is level of visualization of information, its interpretation and association on any ground. Second level can be defined as a visualization of knowledge, depiction of thoughts and ideas in the form of images or diagrams. Finally, the level of data visualization, which processes data arrays in charts, enabling the information to be more clearly perceived. You can also identify the main approaches to the creation of infographics: exploratory and narrative. Exploratory method insists on minimalist design in favor of data precision without unnecessary details and is common for scientific researches and ana

Geo Map — USA — Mississippi

Mississippi is a U.S. state located in the Southern United States.
The vector stencils library Mississippi contains contours for ConceptDraw DIAGRAM diagramming and vector drawing software. This library is contained in the Continent Maps solution from Maps area of ConceptDraw Solution Park.

Flowchart design. Flowchart symbols, shapes, stencils and icons
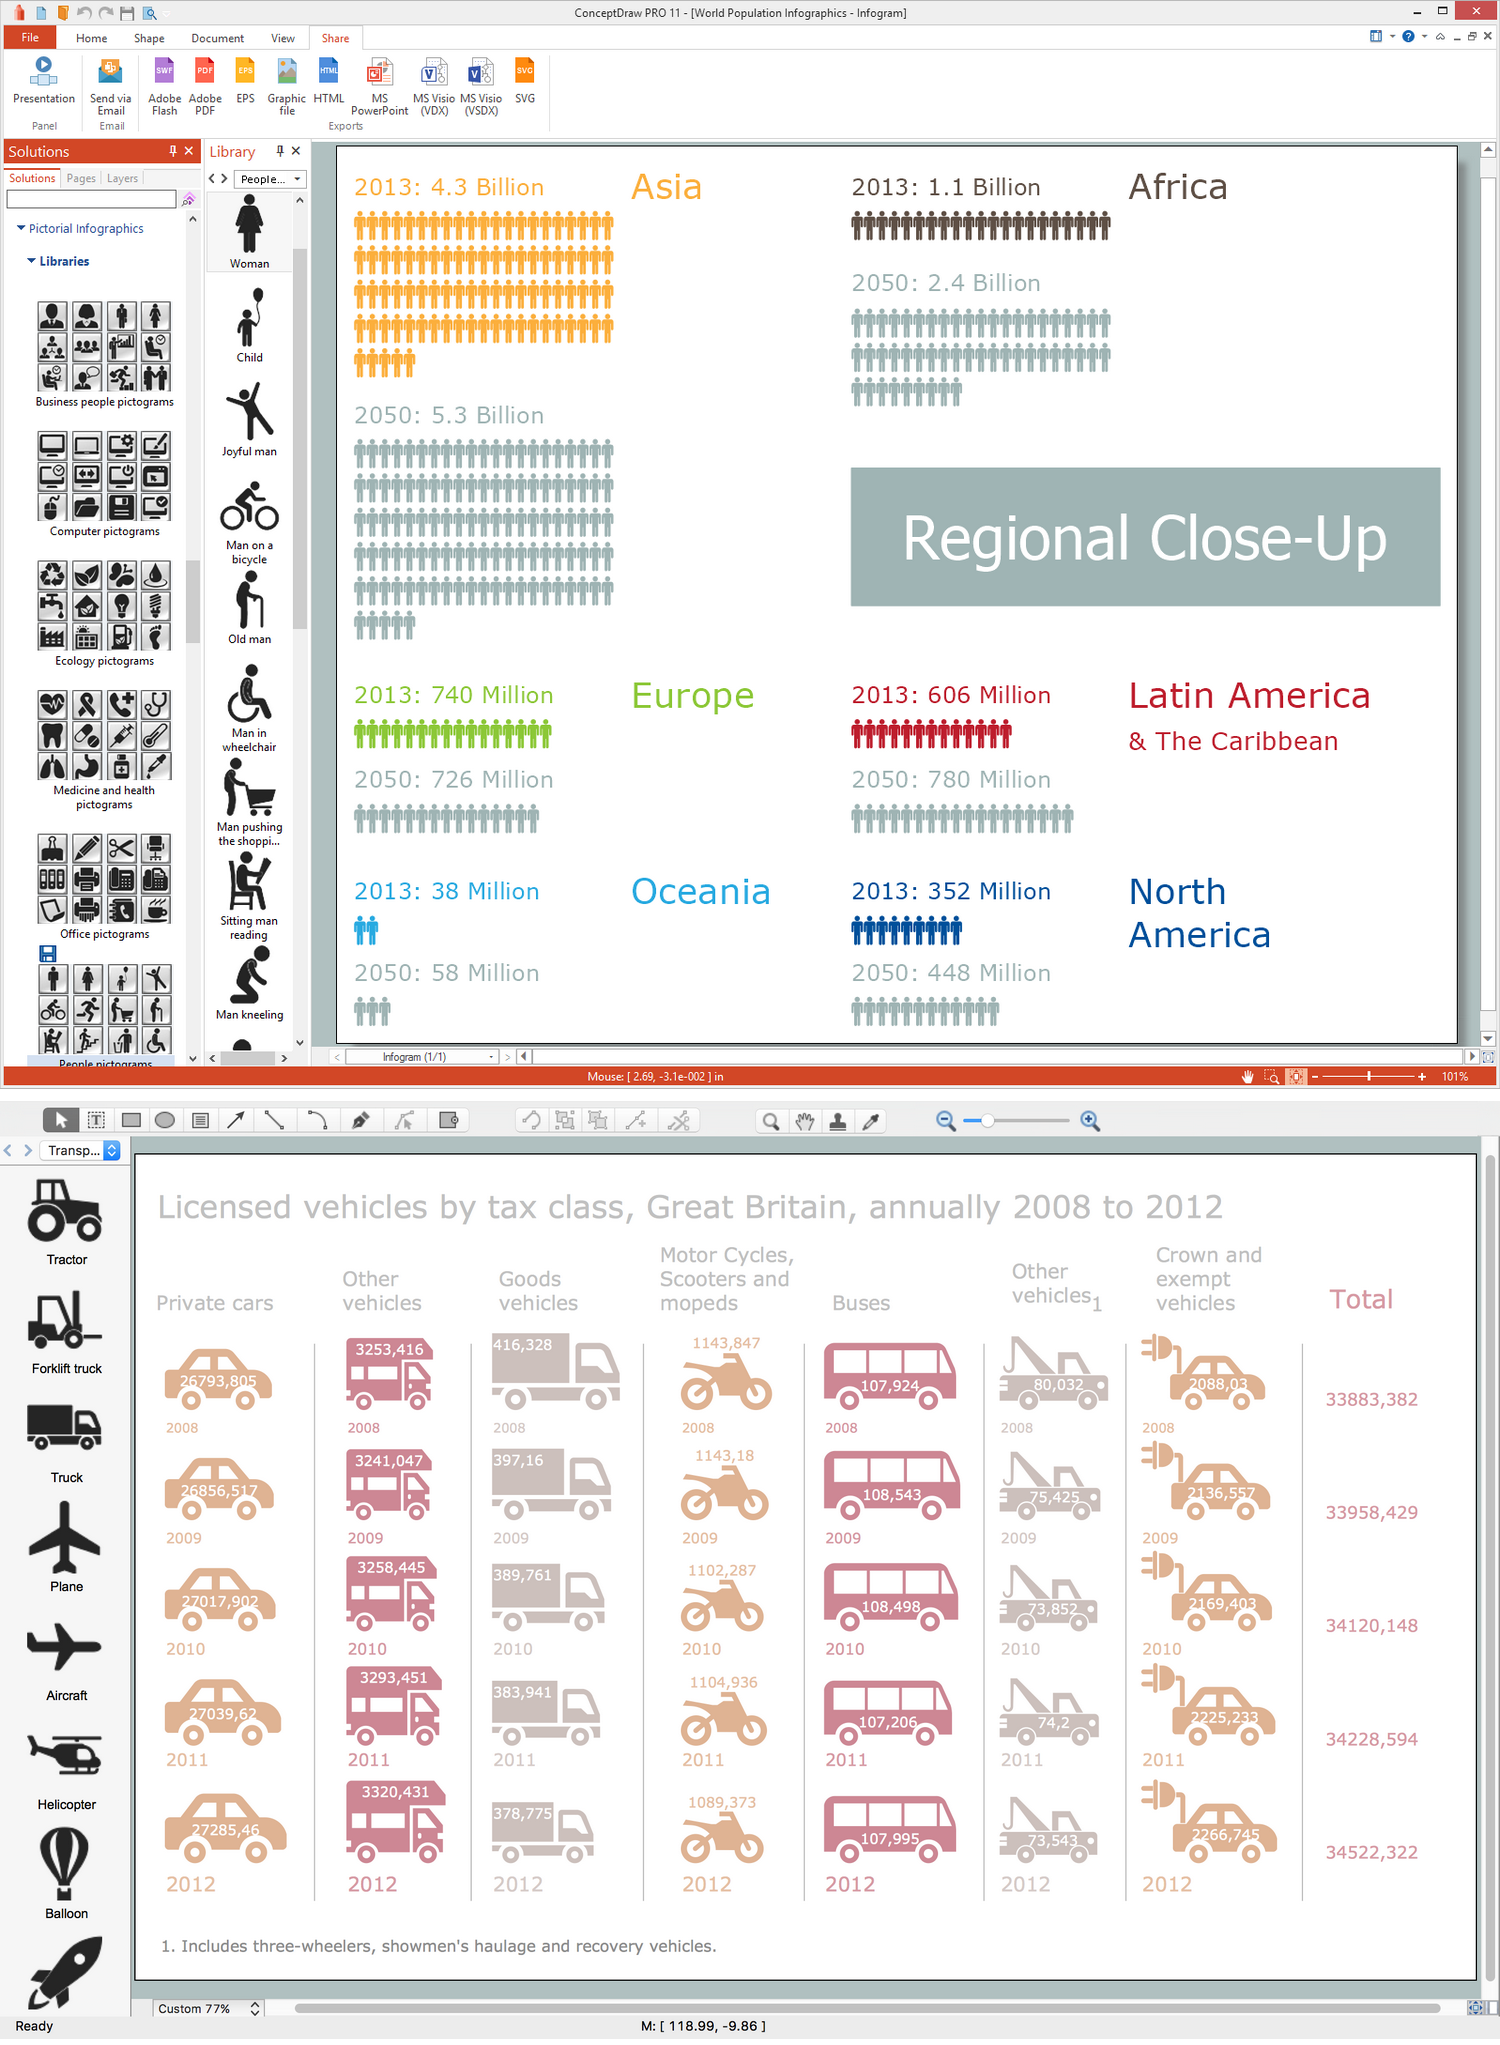
A flowchart is a type of diagram that represents an algorithm, workflow or process, showing the steps as boxes of various kinds - flowchart symbols, and their order by connecting them with arrows.
Mavericks have always desired to stand apart and gorgeous design is the recipe for that. Any business graphic document will be more understandable if will use an expository color scheme for their parts. Flowchart design makes versatile presenting and explaining of the process and gives a fresh view that distinguishes it from black and white flowcharts on a paper. Workflow diagram or process flow diagrams become more understandable to ordinary people when it use minimum symbols and special signs.
The best design can be accomplished by starting from any of the suitable Conceptdraw examples. Pick one of them and begin to input proper text into each Flowchart symbols and shapes. Apply less colors in the document and don't turn into rainbow your diagram, three or four will be enough, also note that business process flowchart may not contain bright color hues. The next clue is to use identical colors for same flowchart shape types.
Business Process Modeling with ConceptDraw
Business Process Modeling with ConceptDraw "Business Process Diagrams" Solution

Infographic Maker

Infographic is a visual way of representing various information, data, knowledge in statistics, geography, journalism, education, and much more areas. ConceptDraw DIAGRAM supplied with Pictorial Infographics Solution from the “Infographics” Area, provides a set of powerful pictorial infographics tools. Thanks to them it is the best Infographic Maker.

Pictorial Chart

You want design Pictorial Chart or Infographic? And you need powerful infographic software? Then ConceptDraw DIAGRAM diagramming and vector drawing software extended with Pictorial Infographics Solution from the “Infographics” Area is exactly what you need.

ceiling ideas, reflected ceiling plans, ceiling ideas for living room, reflected ceiling plan symbols, reflective ceiling plans, ceiling design ideas, reflected ceiling plan? Reflected Ceiling Plans

ceiling ideas, reflected ceiling plans, ceiling ideas for living room, reflected ceiling plan symbols, reflective ceiling plans, ceiling design ideas, reflected ceiling plan?
Reflected Ceiling Plans solution extends greatly the ConceptDraw DIAGRAM functionality with samples, templates and libraries of design elements for displaying the ceiling ideas for living room, bedroom, classroom, office, shop, restaurant, and many other premises. It is an effective tool for architects, designers, builders, electricians, and other building-related people to represent their ceiling design ideas and create Reflected Ceiling plan or Reflective Ceiling plan, showing the location of light fixtures, lighting panels, drywall or t-bar ceiling patterns, HVAC grilles or diffusers that may be suspended from the ceiling. Being professional-looking and vivid, these plans perfectly reflect your ceiling ideas and can be presented to the client, in reports, in presentations, on discussions with colleagues, or successfully published in modern print or web editions.

Infographic Software

ConceptDraw DIAGRAM extended with Pictorial Infographics Solution from the “Infographics” Area is a powerful Infographic Software. Make sure in it right now!

How to Draw Pictorial Chart. How to Use Infograms

How to draw pictorial chart quick, easy and effective? ConceptDraw DIAGRAM offers the unique Pictorial Infographics Solution that will help you!
Pictorial Infographics solution contains large number of libraries with variety of predesigned vector pictograms that allows you design infographics in minutes. There are available 10 libraries with 197 vector pictograms.

Social Media Flowchart Symbols

Social media is a popular view of mass communication which allows people, companies and organizations create, share, discover, modify, access, comment, discuss and exchange information through the Internet. Social Media Response solution for ConceptDraw DIAGRAM provides collection of 10 libraries with diversity of predesigned vector social media flowchart symbols for fast and easy creating interactive Social Media Flowcharts, Response Charts and Action Mind Maps.