This site uses cookies. By continuing to browse the ConceptDraw site you are agreeing to our Use of Site Cookies.

Design Pictorial Infographics. Design Infographics

In the course of recent decades data visualization went through significant development and has become an indispensable tool of journalism, business intelligence and science. The way visual information may be conveyed is not limited simply to static or dynamic representation, it can also be interactive. Infographics can be conditionally divided into several general levels. Primarily, this is level of visualization of information, its interpretation and association on any ground. Second level can be defined as a visualization of knowledge, depiction of thoughts and ideas in the form of images or diagrams. Finally, the level of data visualization, which processes data arrays in charts, enabling the information to be more clearly perceived. You can also identify the main approaches to the creation of infographics: exploratory and narrative. Exploratory method insists on minimalist design in favor of data precision without unnecessary details and is common for scientific researches and ana

Infographic Maker

Infographic is a visual way of representing various information, data, knowledge in statistics, geography, journalism, education, and much more areas. ConceptDraw DIAGRAM supplied with Pictorial Infographics Solution from the “Infographics” Area, provides a set of powerful pictorial infographics tools. Thanks to them it is the best Infographic Maker.

Pictorial Chart

You want design Pictorial Chart or Infographic? And you need powerful infographic software? Then ConceptDraw DIAGRAM diagramming and vector drawing software extended with Pictorial Infographics Solution from the “Infographics” Area is exactly what you need.
HelpDesk

How to Create Infographics that Help People Eat Healthy

The most effective manner of presenting information on a healthy diet and food nutrition is using various visualizations such as charts or infographics. To help easily create infographics and diagrams of healthy eating, ConceptDraw has provided the Health Food solution to its Solution Park. It contains vector stencil libraries of healthy eating options, samples of diagrams and infographics, and a set of templates to help you create your own diagrams, infographics and even adds. Using ConceptDraw DIAGRAM you can easily create and share healthy food recipes and materials about the proper nutrition.

Winter Sports. Olympic Games Infographics. Medal Table

Visualizing data in infographics format is a modern way to represent any statistics related to global sporting events, such as Winter Olympic Games. ConceptDraw DIAGRAM software extended with the Winter Sports solution delivers a rich set of samples and templates helps you produce all kind of sporting information, such as tournament schedule or medal table.

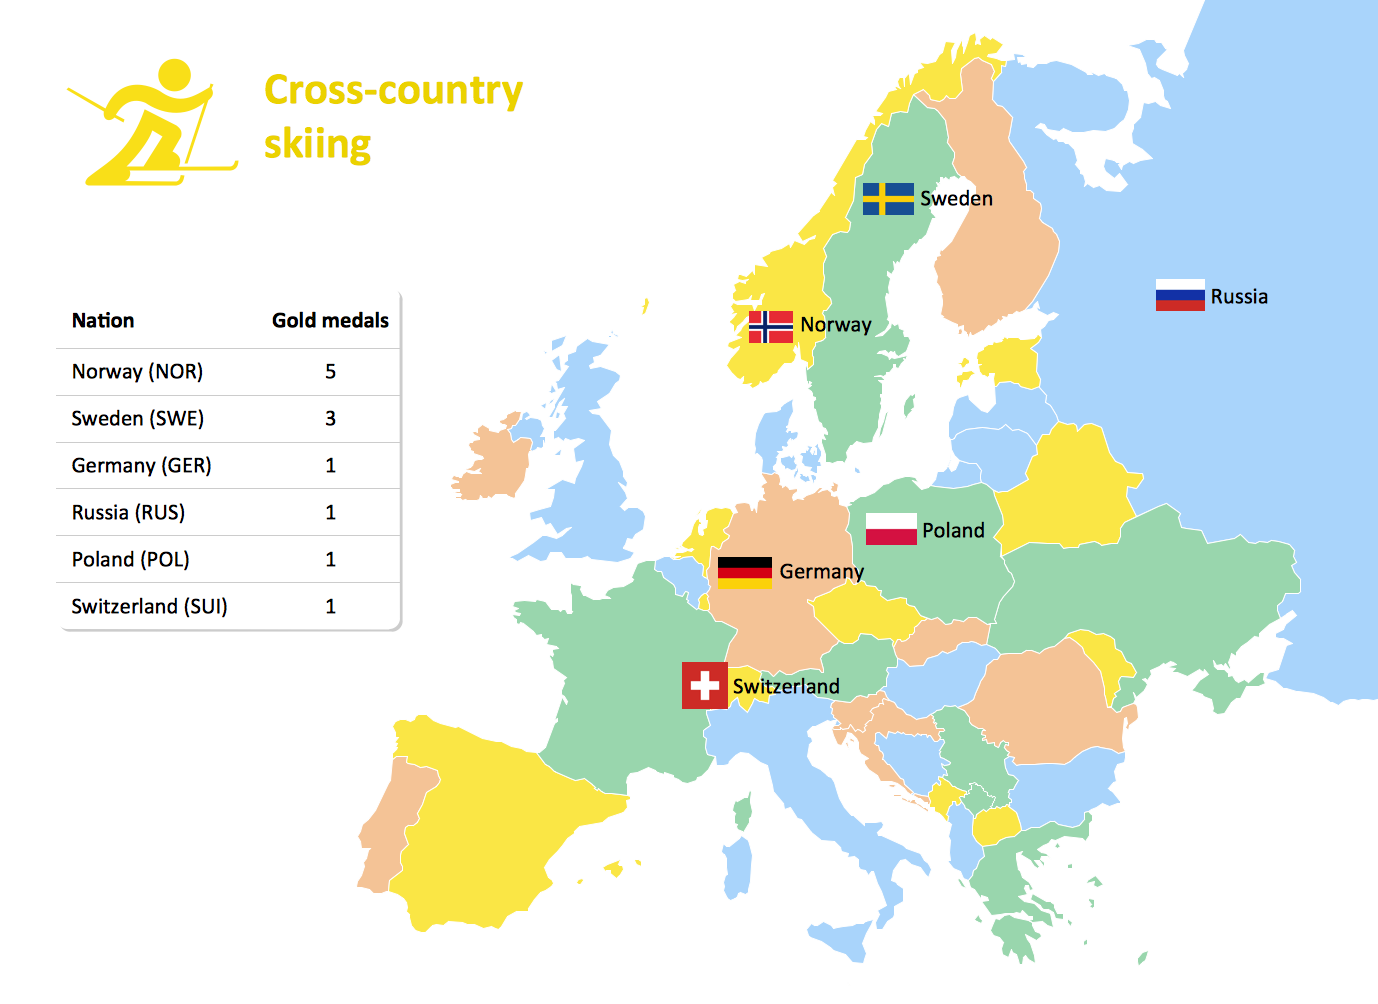
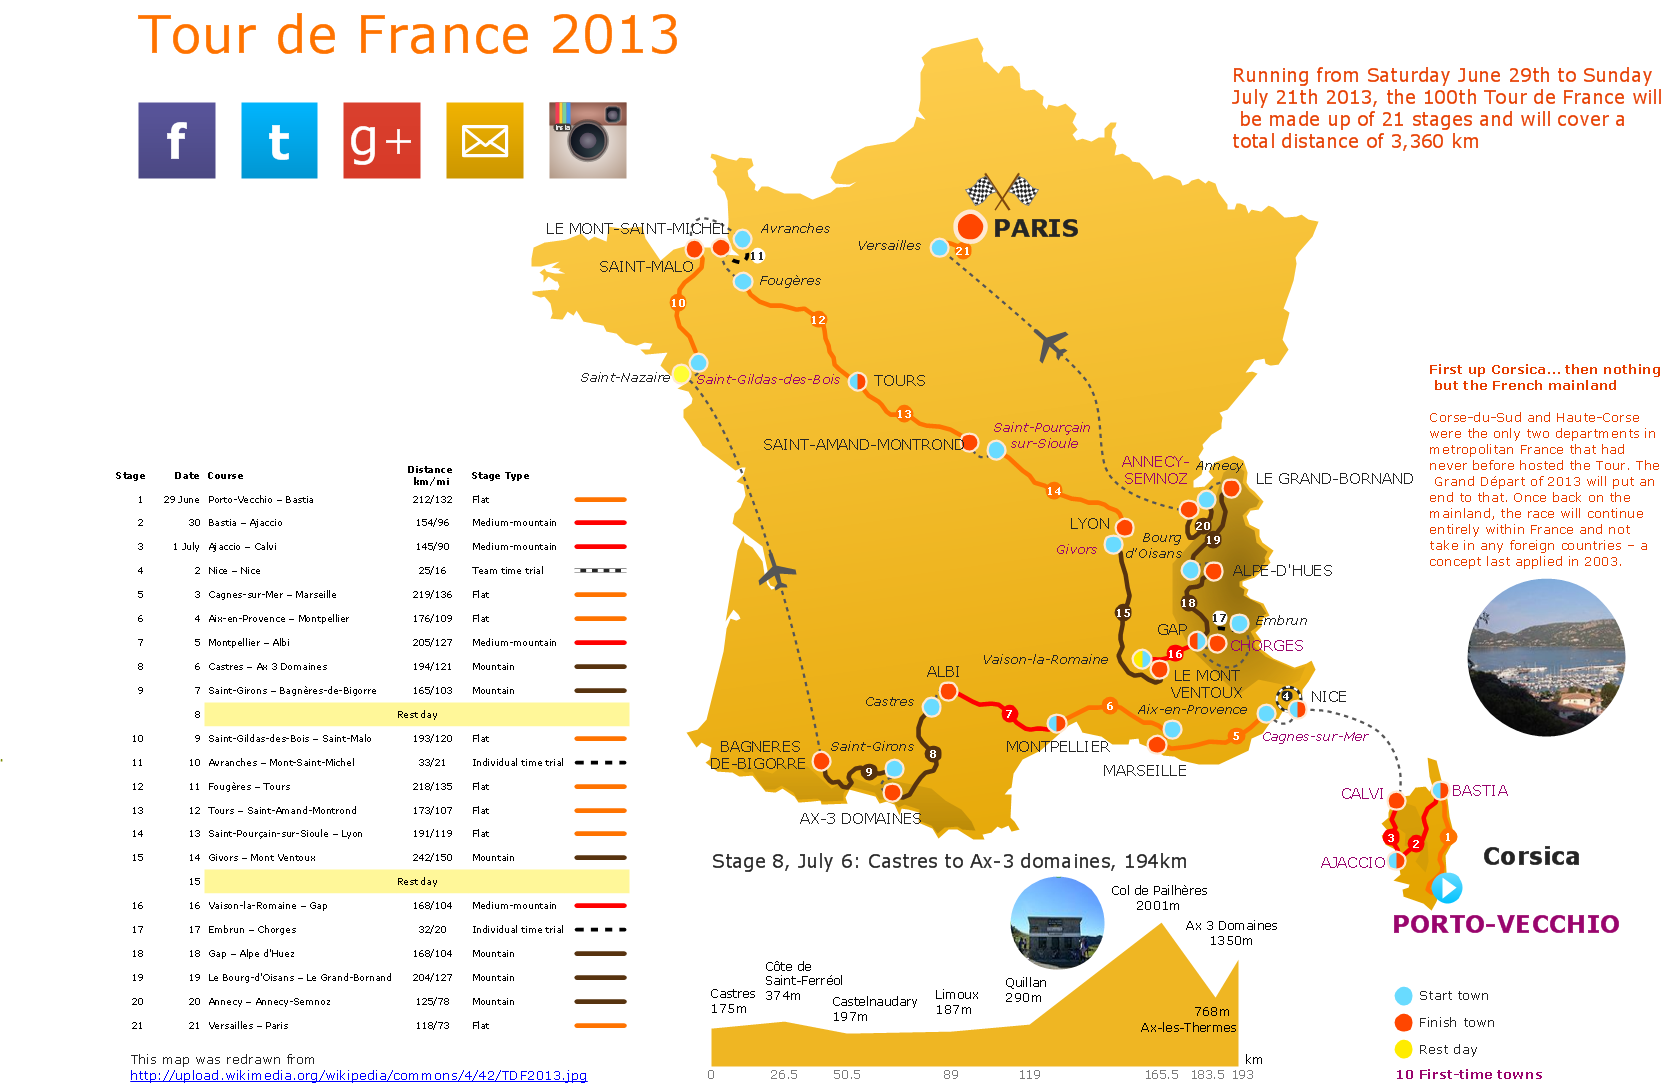
Superb Examples of Infographic Maps

Great examples of Infographic Maps, they are needed for inspiration.

Infographic Software

ConceptDraw DIAGRAM extended with Pictorial Infographics Solution from the “Infographics” Area is a powerful Infographic Software. Make sure in it right now!

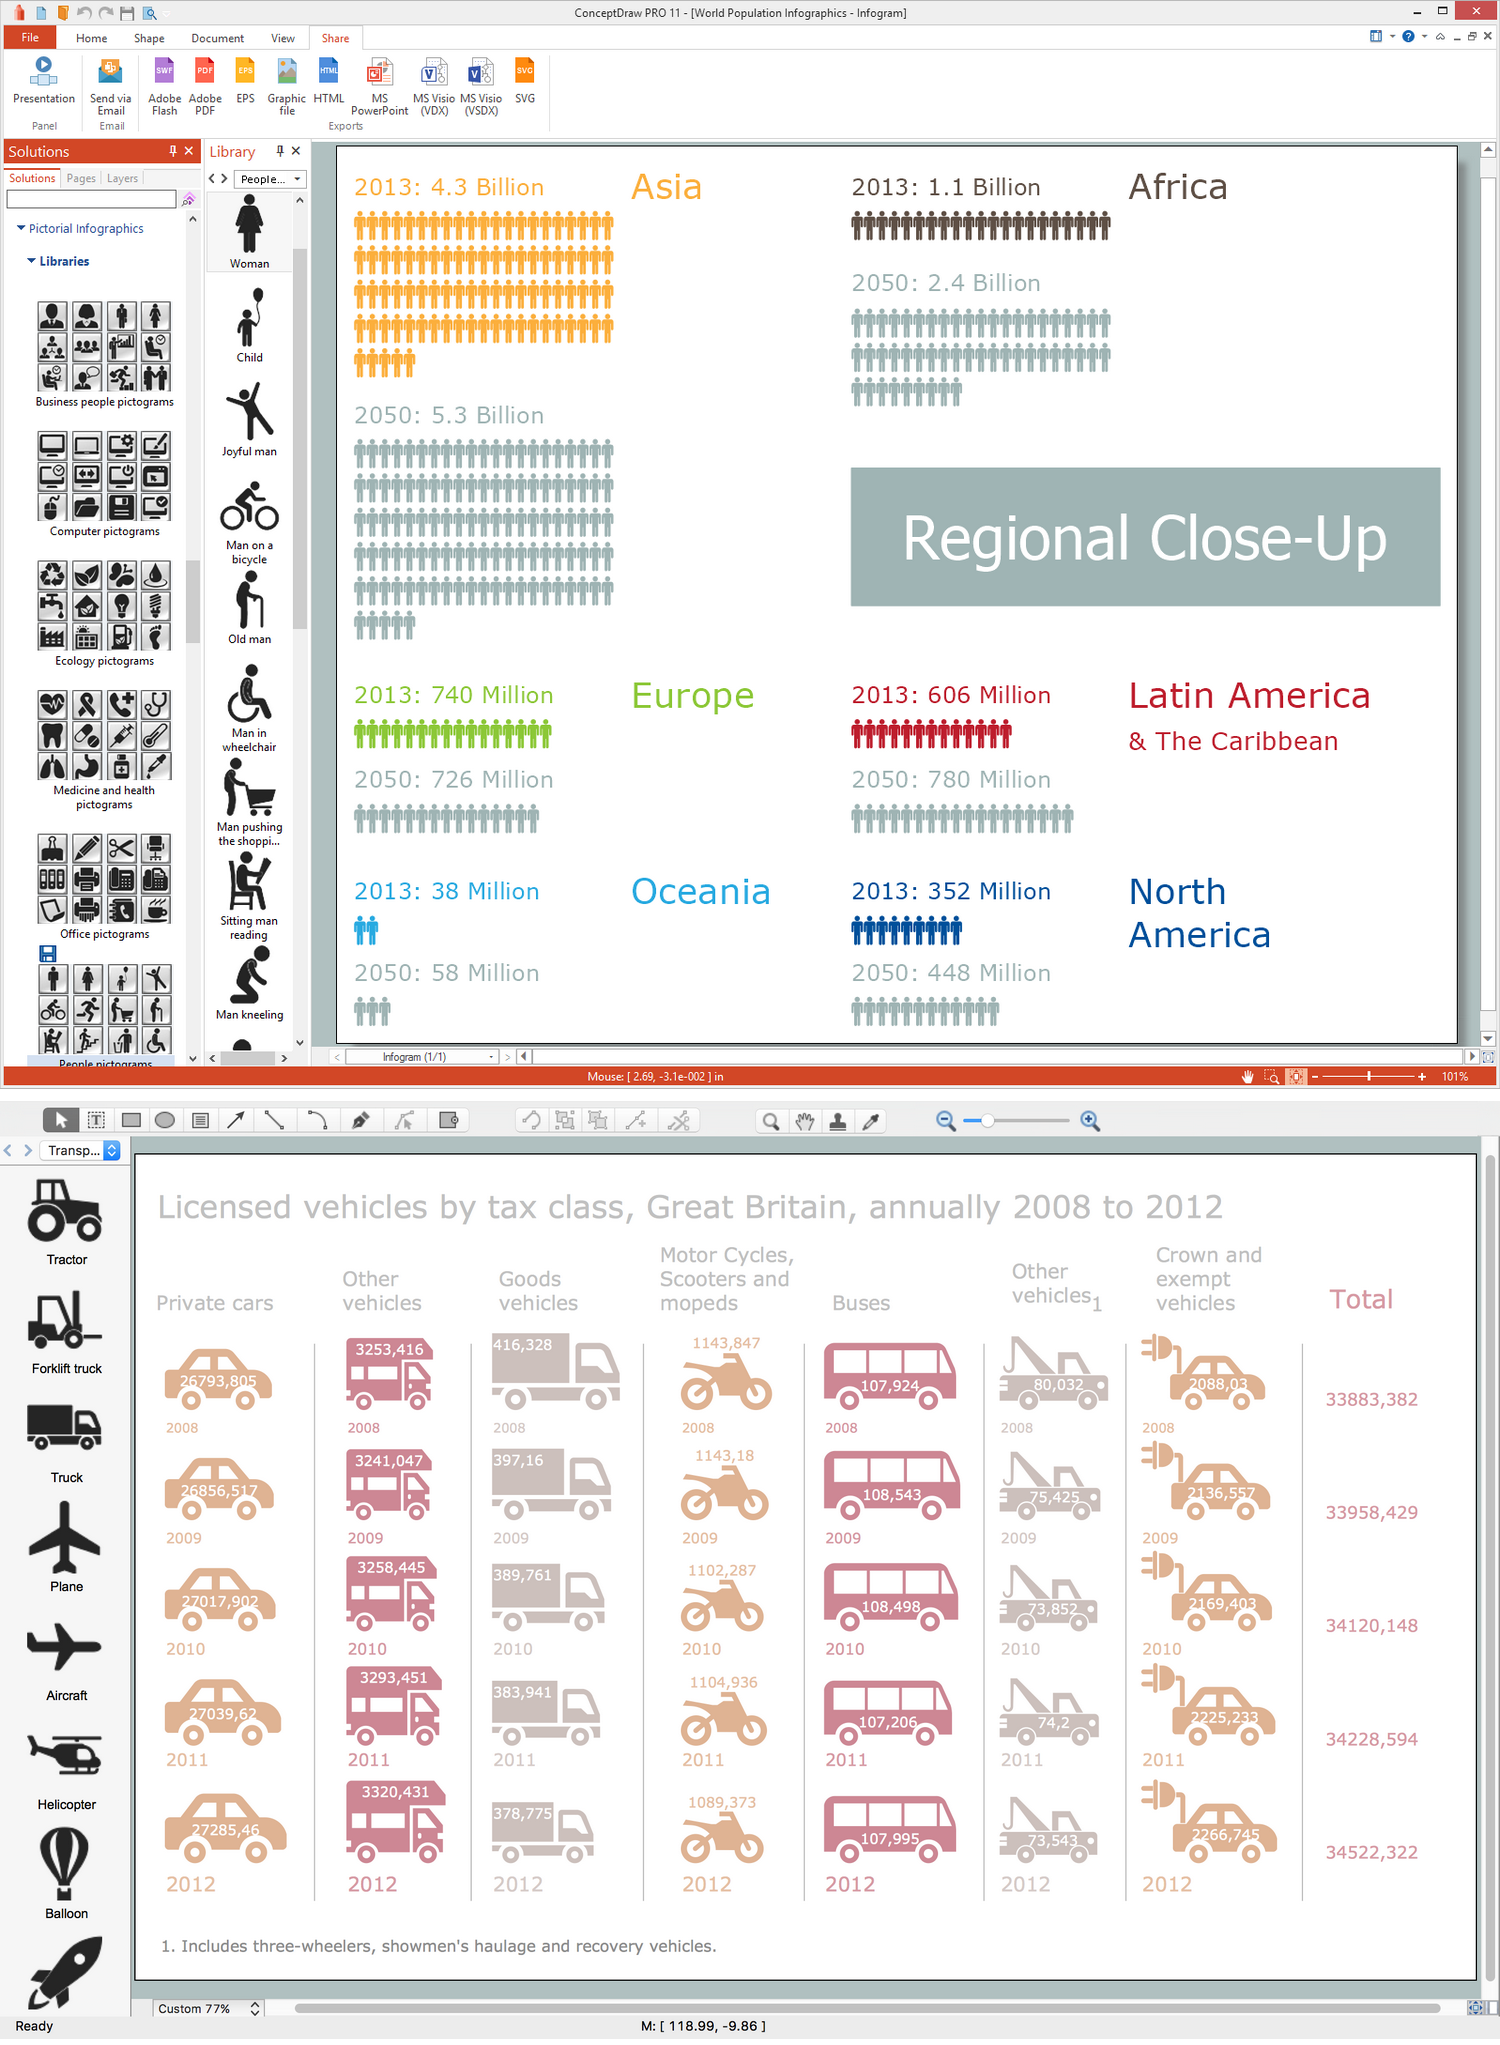
How to Draw Pictorial Chart. How to Use Infograms

How to draw pictorial chart quick, easy and effective? ConceptDraw DIAGRAM offers the unique Pictorial Infographics Solution that will help you!
Pictorial Infographics solution contains large number of libraries with variety of predesigned vector pictograms that allows you design infographics in minutes. There are available 10 libraries with 197 vector pictograms.