Piping and Instrumentation Diagram Software
Piping and Instrumentation Diagram is a technical sketch or drawing, which shows in details the piping system and instrumentation of a processing plant. Piping and Instrumentation Diagram is developed by process design engineers and technical engineers on the phase of plant design. This plan is necessary on the stages of plant construction and then is actively used by operators, instrumentation and piping engineers when operating the plant. ConceptDraw DIAGRAM software provides unique Plumbing and Piping Plans solution from Building Plans area of ConceptDraw Solution Park with 10 libraries of ready-to-use predesigned vector elements, templates and samples, to help you create professional Piping diagrams and schematics, Instrumentation diagrams, Plumbing plans and blueprints, Schemes of hot and cold water supply systems, Heating schemes, Mechanical diagrams, Diagrams of fluids, hydraulics, air and gas pipings, Technical drawings of waste water disposal systems, Schematics of industrial piping systems, Diagrams of ventilation systems, etc.
Chemical and Process Engineering
This chemical engineering solution extends ConceptDraw DIAGRAM.9.5 (or later) with process flow diagram symbols, samples, process diagrams templates and libraries of design elements for creating process and instrumentation diagrams, block flow diagrams (BFD
ERD Symbols and Meanings
Entity Relationship Diagram (ERD) is a popular software engineering tool for database modeling and illustration the logical structure of databases, which uses one of two notations - Chen's or Crow’s Foot. Crow's foot notation is effective when used in software engineering, information engineering, structured systems analysis and design. Each of these notations applies its own set of ERD symbols. Crow's foot diagrams use boxes to represent entities and lines between these boxes to show relationships. Varied shapes at the ends of lines depict the cardinality of a given relationship. Chen's ERD notation is more detailed way to represent entities and relationships. ConceptDraw DIAGRAM application enhanced with all-inclusive Entity-Relationship Diagram (ERD) solution allows design professional ER diagrams with Chen's or Crow’s Foot notation on your choice. It contains the full set of ready-to-use standardized ERD symbols and meanings helpful for quickly drawing, collection of predesigned ERD samples, examples and templates. ConceptDraw Pro is a great alternative to Visio for Mac users as it offers more features and can easily handle the most demanding professional needs.
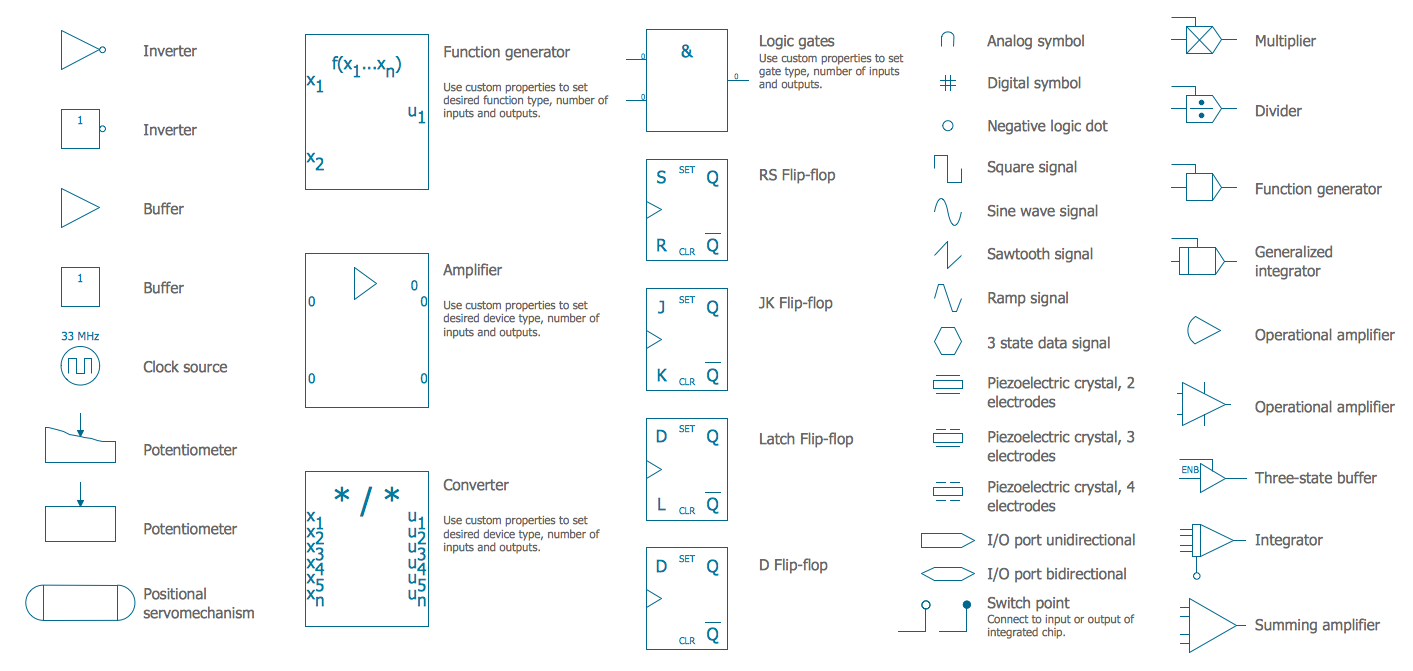
Electrical Symbols — Analog and Digital Logic
Digital electronics or digital (electronic) circuits are electronics that handle digital signals – discrete bands of analog levels – rather than by continuous ranges (as used in analogue electronics). All levels within a band of values represent the same numeric value. Because of this discretization, relatively small changes to the analog signal levels due to manufacturing tolerance, signal attenuation or parasitic noise do not leave the discrete envelope, and as a result are ignored by signal state sensing circuitry. 26 libraries of the Electrical Engineering Solution of ConceptDraw DIAGRAM make your electrical diagramming simple, efficient, and effective. You can simply and quickly drop the ready-to-use objects from libraries into your document to create the electrical diagram.Process Flow Diagram Symbols
Chemical and Process Engineering Solution from the Industrial Engineering Area of ConceptDraw Solution Park is a unique tool which contains variety of predesigned process flow diagram symbols for easy creating various Chemical and Process Flow Diagrams in ConceptDraw DIAGRAM.
Specification and Description Language (SDL)
For people in the field of systems engineering or system design, working with specification and description language (sdl) and finite state machines (fsm).
MS Visio Look a Like Diagrams
No need for any special drawing skills to create professional looking diagrams outside of your knowledge base. ConceptDraw DIAGRAM takes care of the technical details, allowing you to focus on your job, not the drawing. ConceptDraw DIAGRAM delivers full-functioned alternative to MS Visio. ConceptDraw DIAGRAM supports import of Visio files. ConceptDraw DIAGRAM supports flowcharting, swimlane, orgchart, project chart, mind map, decision tree, cause and effect, charts and graphs, and many other diagram types.
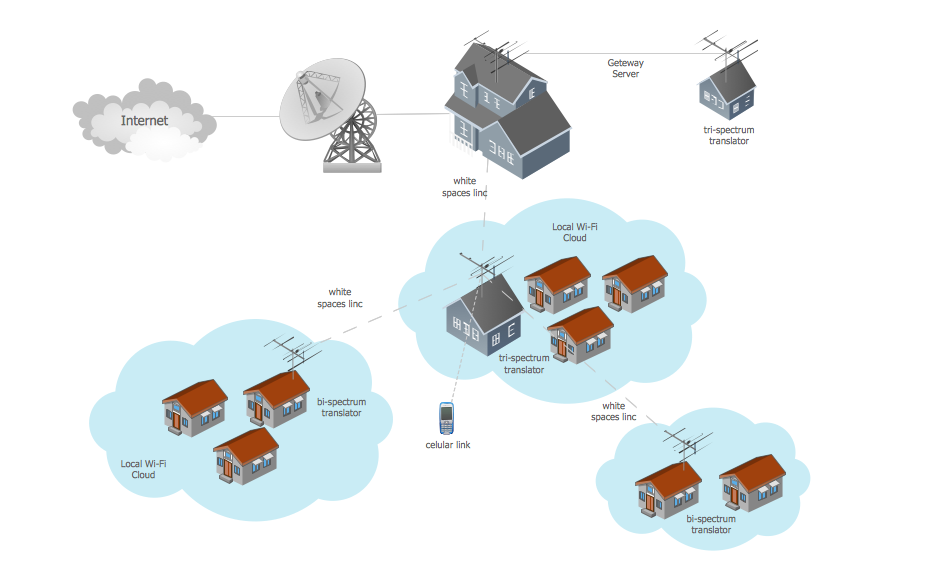
Wide area network (WAN) topology. Computer and Network Examples
Wide area network (WAN) is a type of telecommunication network, which is used to connect the computers on a wide geographical area. WANs are quite popular and widely used networks, the most known and bright example of WAN is the Internet. They offer exceedingly convenient and quick way of exchanging information and data between employees, suppliers, and clients that are geographically remote each other. WANs are often constructed from several smaller networks (LANs, MANs, etc.) and use effectively different packet switching and circuit switching technologies. ConceptDraw DIAGRAM is a powerful network diagramming software. Including Computer and Networks Area with extensive variety of solutions, ConceptDraw DIAGRAM offers a lot of ready-to-use predesigned vector stencils, wide set of examples and samples, helping the business and government entities effectively design professional-looking Wide area networks (WANs) and Wide area network topology diagrams of any complexity. Wide export capabilities of ConceptDraw DIAGRAM greatly extend your opportunities.
Design Data Flow. DFD Library
Data flow diagram or DFD is a type of diagrams used for graphical representation the "flow" of data through an information system, for effective modeling its process aspects and for visualization the data processing. They are one of the best tools for clearly making an overview of the system that will be developed, for depiction in details what kinds of information will be inputted to the system and outputted from it, where they will be stored, and other details. ConceptDraw DIAGRAM software with Data Flow Diagrams solution from Software Development area of ConceptDraw Solution Park is powerful in a field of designing the DFDs. Three libraries containing 49 vector DFD shapes and symbols are offered by Data Flow Diagrams (DFD) solution. Use them to design data flow diagrams, information flow diagrams, data flowcharts, data process diagrams, structured analysis diagrams, to create the data-oriented models or process-oriented models, and so on. Pay also attention for the included collection of DFD samples, examples and built-in templates at ConceptDraw STORE.
Pyramid Diagrams
Pyramid Diagrams solution extends ConceptDraw DIAGRAM software with templates, samples and library of vector stencils for drawing the marketing pyramid diagrams.
- Visio P
- Free Download Software Conceptdraw For Pfd And Pid
- Chemical and Process Engineering | Filter Pipeline Symbol
- What Is P Id
- Ppt Presentation Download For P And Id Diagrams
- Marketing P
- Chemical and Process Engineering | How to Draw a Chemical ...
- Drawing P
- Chemical and Process Engineering | Chemical Engineering ...
- HVAC Plans | Process and Instrumentation Diagram | Air Ventilation ...