ConceptDraw PROJECT Software Overview

UML Diagram

Data Flow Diagram Symbols. DFD Library

Venn Diagram Examples for Problem Solving. Venn Diagram as a Truth Table

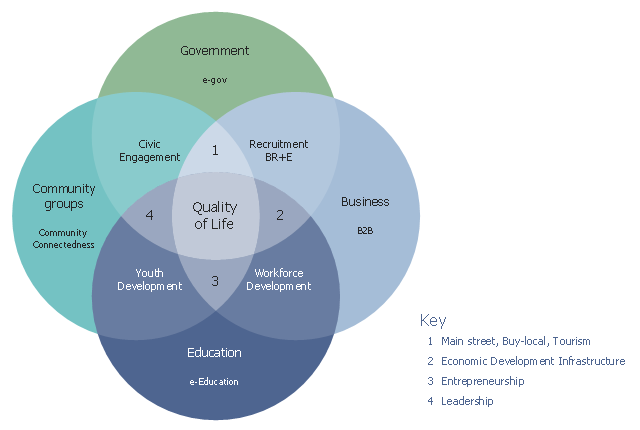
This Venn diagram sample shows how community elements overlap. It was designed on the base of the figure 1 in the course "eStrategies for Local Governments" from the website of the Southern Rural Development Center (SRDC), the Mississippi State University.
"Ultimately, the goal of this curriculum is to position a community for success as they develop web-based strategies for community and economic development. In support of this goal, the authors use a conceptual model that incorporates four fundamental elements (applications) of a community: government, business, education and community groups (Figure 1). Using the Venn diagram, it shows that each of these elements overlap with another, finally culminating in “Quality of Life” where all four overlap." [srdc.msstate.edu/ ecommerce/ curricula/ egovernment/ overview.html]
The Venn diagram example "Community elements overlapping" was created using the ConceptDraw PRO diagramming and vector drawing software extended with the Venn Diagrams solution from the area "What is a Diagram" of ConceptDraw Solution Park.
Venn diagram
Example of DFD for Online Store (Data Flow Diagram)


 Overview Reports
The Overview Reports solution extends the functionality of ConceptDraw PROJECT management software with a set of projects examples and capabilities to generate such project management report types as Project Overview or Project Overview with Resource Costs at your choice. These reports allow the project managers and team leaders to track and to analyze the main information on your project, the information about project’s tasks and usage of work and material resources, to evaluate the project progress in comparison with its state at a planning stage and at the moment of previous reporting period, to estimate the effectiveness of resources use, to detect the tasks that require additional efforts and possible irrationalities in resources allocation within a single project or several projects in a multiproject.
Venn Diagram Examples for Problem Solving

Venn Diagram Examples for Problem Solving. Computer Science. Chomsky Hierarchy

Value Stream & Process Flow Diagramming Software

- Photooxygenation | Types Of Venn Diagrams
- Community elements overlapping | Germany Map | Venn Diagram ...
- Venn Diagrams | Community elements overlapping | Path to ...
- Community elements overlapping | Venn Diagrams | Path to ...
- Biology | Glycolysis overview diagram | Draw Biological Pathways ...
- Cross Functional Flowchart Examples | Human Values Flow Chart ...
- Interaction Overview Diagram | Diagramming Software for Design ...
- Interaction Overview Diagram | UML Component Diagram . Design ...
- Push Notification Lifecycle Overview | DroidDia PRO unlocker ...
- Product Overview | Gantt Chart Solved Examples