 ConceptDraw Solution Park
ConceptDraw Solution Park collects graphic extensions, examples and learning materials
HelpDesk
How to Create an Enterprise Architecture Diagram

Applications

HelpDesk
How to Make a UML Diagram

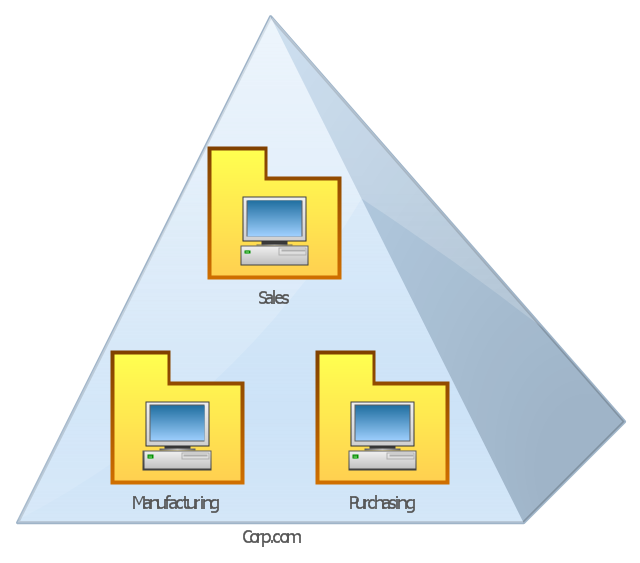
This AD diagram example was redesigned from the picture "Single root domain with a structured OU model" from the book "Active Directory for Dummies".
"A domain is the cornerstone that you lay whenever you create trees and forests. Regardless of whether you design a tree or a forest, the starting point is always the root domain. The root domain is the first domain that you create in your AD structure, and it sits at the top of your diagram.
The root domain of your tree, similar to any other domain, is a grouping of
resources built on the following components:
(1) Domain controllers.
(2) Security policies. ...
For many small and medium-sized companies, a single root domain with a
structured OU (organizational unit) model... provides sufficient flexibility for an AD tree. ...
However, larger companies, companies with complex organization charts, and
companies with multiple sites often find that a single domain isn’t suitable." [Steve Clines and Marcia Loughry, Active Directory® For Dummies®, 2nd Edition. 2008]
The Active Directory diagram example "Single root domain with a structured OU model" was created using the ConceptDraw PRO diagramming and vector drawing software extended with the Active Directory Diagrams solution from the Computer and Networks area of ConceptDraw Solution Park.
Active Directory network diagram
Databases Access Objects Model with ConceptDraw DIAGRAM
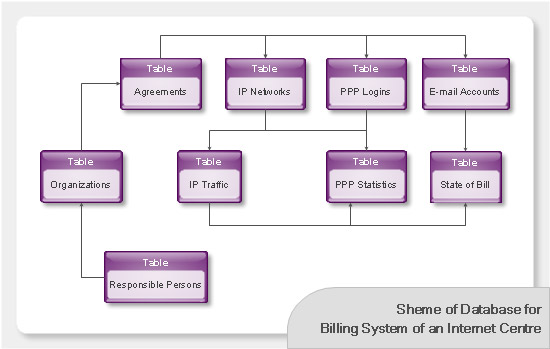
Data modeling with ConceptDraw DIAGRAM

HelpDesk
How To Create an Affinity Diagram Using Solutions

- How to Draw an Organization Chart | ConceptDraw PRO ...
- Data structure diagram with ConceptDraw PRO | Organizational ...
- Organizational Structure | Software and Database Design with ...
- How to Draw an Organization Chart | Organizational Structure ...
- Organizational Charts with ConceptDraw PRO | Organizational ...
- Data structure diagram with ConceptDraw PRO | ConceptDraw PRO ...
- Organizational Structure | Data structure diagram with ConceptDraw ...
- 5 level pyramid model diagram of information systems types ...
- Organizational Structure | How To Do A Mind Map In PowerPoint ...
- ER Diagrams with ConceptDraw PRO | Organizational Structure ...
- Organizational Structure Total Quality Management | Identifying ...
- ConceptDraw PRO - Organizational chart software | Organizational ...
- How to Draw an Organization Chart | Pyramid Diagram | Business ...
- Bubble diagrams in Landscape Design with ConceptDraw PRO ...
- Data structure diagram with ConceptDraw PRO | ConceptDraw PRO ...
- ConceptDraw PRO - Organizational chart software | Organizational ...
- Visualization of databases with ConceptDraw PRO | Databases ...
- Data structure diagram with ConceptDraw PRO | ConceptDraw PRO ...
- Development of software with ConceptDraw PRO | Organizational ...
- Data Flow Diagrams | Types of Flowchart - Overview | Business ...