This site uses cookies. By continuing to browse the ConceptDraw site you are agreeing to our Use of Site Cookies.

Example of DFD for Online Store (Data Flow Diagram)

Data flow diagrams (DFDs) reveal relationships among and between the various components in a program or system. DFDs are an important technique for modeling a system’s high-level detail by showing how input data is transformed to output results through a sequence of functional transformations.
Example of DFD for Online Store shows the Data Flow Diagram for online store and interactions between the Visitors, Customers and Sellers, as well as Website Information and User databases.
Steps to Creating a Sales Process Flow Chart

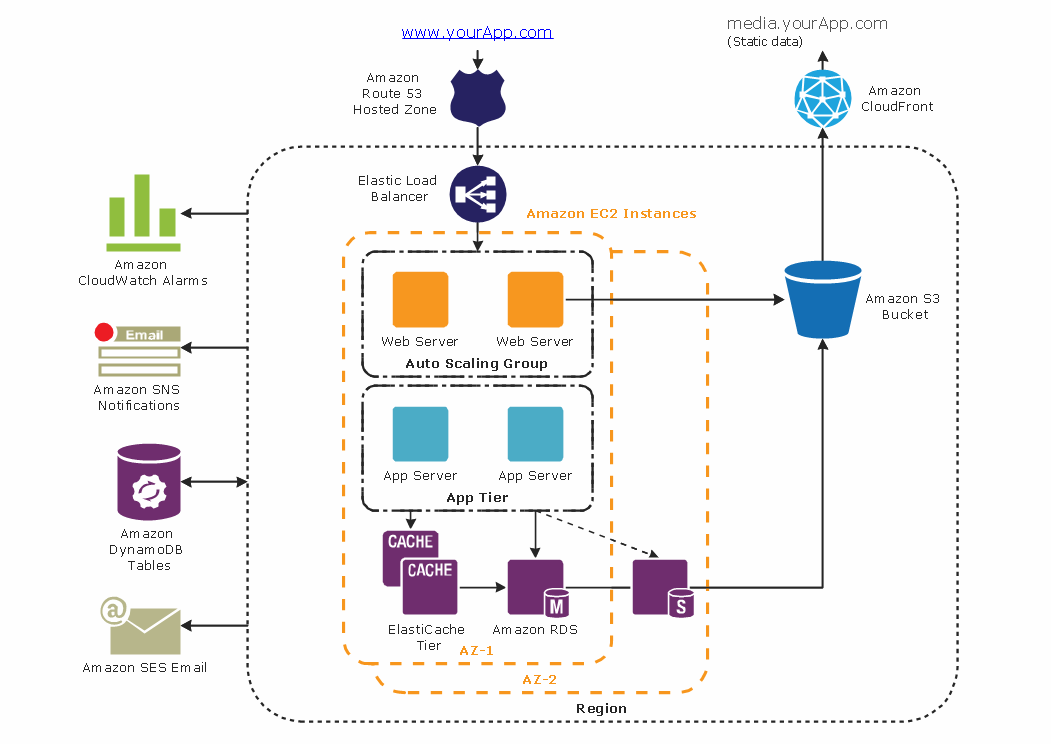
Amazon Web Services Diagrams diagramming tool for architecture

The AWS Architecture Diagrams solution includes icons, sample and templates for several Amazon Web Services products and resources, to be used when creating architecture diagrams. The icons are designed to be simple so that you can easily incorporate them in your diagrams and put them in your whitepapers, presentations, datasheets, posters or any technical material you like. Here you will find an official collection of AWS resources that will help you build great AWS Architecture diagrams.

Windows Azure

The Microsoft Windows Azure platform is a highly flexible cloud-based solution with variety of services which supports not only the execution of.NET applications, but also allows developers to use programming languages like Java, PHP, Node.js, or Python.
ConceptDraw DIAGRAM diagramming and vector drawing software provides the Azure Architecture Solution from the Computer and Networks area of ConceptDraw Solution Park with a lot of useful tools which make easier: illustration of Windows Azure possibilities and features, describing Windows Azure Architecture, drawing Azure Architecture Diagrams, depicting Azure Cloud System Architecture, describing Azure management, Azure storage, documenting Azure services.

Online Collaboration via Skype

Collaborating with co-workers is very important, not only in order to get things done effectively, but also to keep in touch with the outside world. Great way for business collaboration is Skype.

ConceptDraw DIAGRAM ER Diagram Tool

ER-diagram is a tool used for database modeling which allows to determine data and relationships among the data. These diagrams help to detail data storages and to document all the properties of designed system. ER-diagram contains entities, attributes of the entities and the relationships between them. Chen’s notation and Crow’s foot notation are commonly used to represent elements in ER-model. To create such diagram you should use specific software, such as Entity-Relationship Diagram solution for ConceptDraw DIAGRAM.
ConceptDraw ER Diagram Tool works across any platform, meaning you never have to worry about compatibility again. ConceptDraw DIAGRAM allows you to make Entity-Relationship Diagram (ERD) on PC or macOS operating systems.

Basic Flowchart Symbols and Meaning

Flowchart Symbols and Meaning - Provides a visual representation of basic flowchart symbols and their proposed use in professional workflow diagram, standard process flow diagram and communicating the structure of a well-developed web site, as well as their correlation in developing on-line instructional projects. See flowchart's symbols by specifics of process flow diagram symbols and workflow diagram symbols.
How to Build a Flowchart
HelpDesk

How to Make a Web Page from Your Metro Map

Using ConceptDraw DIAGRAM, you can create metro maps, route maps, and various transport schemes. It is easy for anyone to build a map, one does not need to be a cartographer to make good use of the ConceptDraw mapping solutions. Elaborate maps can be quickly assembled and then used on the web, printed, or made into signage. Graphical power and ease of use are built into the ConceptDraw mapping solutions. You can save your drawing as a Web page. ConceptDraw DIAGRAM adds the HTML tags that are needed to display your diagrams in a Web browser, so all you have to do is design their appearance.

Cross-Functional Flowchart

Cross-Functional Flowchart - to draw cross functional process maps is by starting with a cross-functional flowchart samples and templates. Easy to draw sample cross functional Process Flow Diagrams. Using a Cross-Functional flowchart is a clear way of showing each team member’s responsibilities and how processes get shared or transferred between different teams and departments.
Use cross-functional flowcharts to show the relationship between a business process and the functional units (such as departments) responsible for that process. To create it use the best flowchart maker of ConceptDraw DIAGRAM.
How to Draw a Cross Functional Flowchart using visio alternative ConceptDraw DIAGRAM as visio for mac

How to Use the ″Online Store PR Campaign″ Sample

Interactive tool helps you find the appropriate response to social media mentions quickly.

Diagramming tool - Amazon Web Services and Cloud Computing Diagrams

The AWS Architecture Diagrams solution includes icons, sample and templates for several Amazon Web Services products and resources, to be used when creating architecture diagrams. The icons are designed to be simple so that you can easily incorporate them in your diagrams and put them in your whitepapers, presentations, datasheets, posters or any technical material you like.