 HR Dashboard
The HR Dashboard solution extends ConceptDraw DIAGRAM functionality with powerful drawing tools and great collection of comprehensive vector design elements, icons, pictograms and objects, navigation elements, live objects of HR charts, HR indicators, and thematic maps. The range of HR Dashboards applications is extensive, among them the human resource management, recruitment, hiring process, human resource development. ConceptDraw DIAGRAM software is perfect for creation HR Dashboard with any goal you need. It gives you all opportunities for designing not only informative, but also professional looking and attractive HR Dashboards of any style and degree of detalization, that are perfect for using in presentations, reports and other thematic documents.
 Object-Role Modeling (ORM) Diagrams
Object-role Modeling (ORM) Diagram solution with powerful vector diagramming and data modeling tools, large quantity of specially developed samples and examples, and rich variety of vector objects corresponding to common ORM notation, ideally suits for developing the comprehensive, clear and visual Object-role Modeling (ORM) diagrams and schematics, understandable for all interested people from the different fields and business directions, for designing the ORM models, and demonstrating advantages from the use of ORM and its notation. It is intended for software developers and computer engineers, specialists in a field of Object-oriented programming (OOP), database architects, web-application constructors and developers, etc.
 Jackson Structured Programming (JSP) Diagrams
The Jackson Structured Programming (JSP) Diagram solution extends the functionality and drawing abilities of the ConceptDraw DIAGRAM software with set of illustrative JSP diagrams samples and large variety of predesigned vector objects of actions, processes, procedures, selection, iteration, as well as arrows and connectors to join the objects during Jackson structured development and designing Jackson structured programming diagrams, JSP diagram, Jackson structure diagram (JSD), Program structure diagram. The powerful abilities of this solution make the ConceptDraw DIAGRAM ideal assistant for programmers, software developers, structural programmers, computer engineers, applications constructors, designers, specialists in structured programming and Jackson systems design, and other technical, computer and software specialists.
This vector stencils library contains 184 round icons.
Use it to design cloud computing infographics and diagrams with ConceptDraw PRO software.
"Though service-oriented architecture advocates "everything as a service" (with the acronyms EaaS or XaaS or simply aas), cloud-computing providers offer their "services" according to different models, which happen to form a stack: infrastructure-, platform- and software-as-a-service.
Infrastructure as a service (IaaS)
In the most basic cloud-service model ... providers of IaaS offer computers — physical or (more often) virtual machines — and other resources. IaaS refers to online services that abstract the user from the details of infrastructure like physical computing resources, location, data partitioning, scaling, security, backup etc.
Platform as a service (PaaS)
PaaS vendors offer a development environment to application developers. The provider typically develops toolkit and standards for development and channels for distribution and payment. In the PaaS models, cloud providers deliver a computing platform, typically including operating system, programming-language execution environment, database, and web server. Application developers can develop and run their software solutions on a cloud platform without the cost and complexity of buying and managing the underlying hardware and software layers.
Software as a service (SaaS)
In the software as a service (SaaS) model, users gain access to application software and databases. Cloud providers manage the infrastructure and platforms that run the applications. SaaS is sometimes referred to as "on-demand software" and is usually priced on a pay-per-use basis or using a subscription fee.
In the SaaS model, cloud providers install and operate application software in the cloud and cloud users access the software from cloud clients. Cloud users do not manage the cloud infrastructure and platform where the application runs. This eliminates the need to install and run the application on the cloud user's own computers, which simplifies maintenance and support. Cloud applications differ from other applications in their scalability — which can be achieved by cloning tasks onto multiple virtual machines at run-time to meet changing work demand." [Cloud computing. Wikipedia]
The vector stencils library "Cloud round icons" is included in the Cloud Computing Diagrams solution from the Computer and Networks area of ConceptDraw Solution Park.
Add
Analysis
API
App
Archive
Back
Backup
Book
Books
Box
Bug
Calculation
Calendar
Call
Car
CD
Certificate
Cloud alert
Cloud analysis
Cloud authorization
Cloud collaboration
Cloud communications
Cloud computing
Cloud configuration
Cloud connectivity
Cloud control
Cloud cost calculation
Cloud database
Cloud download
Cloud drive
Cloud error
Cloud failure
Cloud FAQ
Cloud feedback
Cloud files
Cloud gateway
Cloud hosting
Cloud info
Cloud Internet storage
Cloud lock
Cloud locked
Cloud mail
Cloud music
Cloud paperless office
Cloud performance
Cloud photo
Cloud safe
Cloud search
Cloud security
Cloud servers
Cloud services
Cloud shopping
Cloud success
Cloud synchronization
Cloud tech support
Cloud transfer
Cloud unlocked
Cloud upload
Cloud video
Code
Collaboration
Communication
Community cloud
Contact list
Content
CPU
Database
Datacenter
Data storage
Desktop
Display
Document
Documents
Dollar
Done
Down
Download
E-commerce
Earth
Email
Encryption
Error
Ethernet
Euro
Failure
Feed
File
Files
Filter
Firewall
Flash drive
Folder
Forward
Hard drive
Hardware
Health
Health monitoring
Home
Hosting
Image
Info
Innovation
Key
Keyboard
Laptop
Letter
Lightning
Link
List
Location
Lock
Log
Login
Logout
Mail
Mail list
Marketplace
Memory (RAM)
Message
Minus
Mobile
Mobile cloud computing
Mouse
Music player
Network
Notebook
Notification
Package
Patch
Performance
Personal cloud
Phone book
Photo
Plug
Pound
Power
Power button
Process
Processing
Puzzles
Question sign
Recovery
Remote
Repair
Restore
Rocket (Logic app)
Router
Safety
Schedule
Script
SDK
Search (Scan)
Security
Server
Server rack
Services
Sharing
Shopping basket
Sign in
Smartphone
Song
Sound
Stethoscope
Stickman
Subscription
Sync
Tablet
Tech support
Time
Top rated
Transfer
Unlink
Unlock
Up
Upload
User
Video mail
View (visual)
Virus protection
Waste bin
Web
Wifi
Wireless
Yen sign
HelpDesk
ConceptDraw Software Full Versions Free Download

 HR Flowcharts
The HR Flowcharts solution is ideal for using while creating the HR-related drawings in the ConceptDraw DIAGRAM charting and drawing software, providing with a comprehensive collection of human resources themed icons, connectors, and images from the available stencil libraries, helping illustrating flowcharts, infographics and workflow diagrams.
 Kanban Board
Kanban Board solution offers an effective way to build the Kanban boards in an electronic view. This solution includes a lot of Kanban Board samples and the great number of predesigned vector design objects of Task Boards, basic symbols, and icons of caution and markers, communication, complete and numbers, emoji and priorities, sticky notes, and team members. Use all advantages of the Kanban boards, Kanban board agile and ConceptDraw’s Kanban Board solution tools, start with any included Kanban Board example and improve your workflow efficiency and personal effectiveness.
Work Order Process Flowchart. Business Process Mapping Examples

 Website Wireframe
The innovative Website Wireframe solution enhances the ConceptDraw DIAGRAM functionality with newest wireframe tools, libraries with variety of predesigned icons, symbols, buttons, graphics, forms, boxes, and many other vector elements, templates and professionally designed samples, which make it the best wireframing software. Website Wireframe solution gives you significant advantages when designing and maintaining websites, creating skeletal and content-free depictions of website structure, making website prototypes and planning the content arrangement before committing to design, also speeds up the processes of sketching, producing and sharing wireframe examples of website style and interface design.
DFD Flowchart Symbols

Basic of Flowchart: Meaning and Symbols


Recruitment

HelpDesk
Flowchart Software Free Download

 Workflow Diagrams
Evaluate all advantages of workflow diagram software ConceptDraw DIAGRAM extended with the Workflow Diagrams solution that includes workflow examples and samples, workflow diagram template, a library of workflow diagram symbols and pictorial vector clipart for drawing visual and intuitively understandable Workflow diagrams. Design pictorial Work flow chart or Work flow diagram easier than ever, use them for documentation and implementation purposes, export in a variety of common graphics formats and share with colleagues. Extend the already wide area Work flow diagrams' applications that are used today in the manufacturing industry, software development, HR, medicine, banking and finance sphere, education, military, government, business, e-commerce, and many other fields.
Orgchart

Influence Diagram Software

IDEF3 Standard

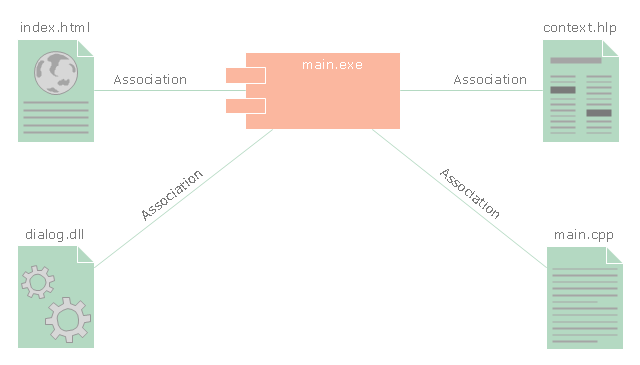
"In the Unified Modeling Language, a component diagram depicts how components are wired together to form larger components and or software systems. They are used to illustrate the structure of arbitrarily complex systems." [Component diagram. Wikipedia]
This UML component diagram example was created using the ConceptDraw PRO diagramming and vector drawing software extended with the Rapid UML solution from the Software Development area of ConceptDraw Solution Park.
This UML component diagram example was created using the ConceptDraw PRO diagramming and vector drawing software extended with the Rapid UML solution from the Software Development area of ConceptDraw Solution Park.
UML component diagram
Simple Flow Chart

 Active Directory Diagrams
Active Directory Diagrams solution significantly extends the capabilities of ConceptDraw DIAGRAM software with special Active Directory samples, convenient template and libraries of Active Directory vector stencils, common icons of sites and services, icons of LDPA elements, which were developed to help you in planning and modelling network structures and network topologies, in designing excellently looking Active Directory diagrams, Active Directory Structure diagrams, and Active Directory Services diagram, which are perfect way to visualize detailed structures of Microsoft Windows networks, Active Directory Domain topology, Active Directory Site topology, Organizational Units (OU), and Exchange Server organization.
- Entity Relationship Diagram Software Engineering | Design Element ...
- What's the best ERD tool for the Mac? | Erds For Job Application
- How to Supervise People | Hiring process BPMN 1.2 diagram ...
- Form Maker | Flowchart Software Free Download | Process ...
- Employment Form Software | Post Employment Committee ...
- Data Flow Diagram | Dfd For Job Application Form
- ConceptDraw PRO DFD Software | Examples Of Job Application Dfd
- Flow chart Example. Warehouse Flowchart | Recruitment | How to ...
- Data Flow Diagram For Job Application
- Form Maker | Pdf Form Designer Software - Conceptdraw.com