 ConceptDraw Solution Park
ConceptDraw Solution Park collects graphic extensions, examples and learning materials
Flow Chart Online

"Targeted advertising is a type of advertising whereby advertisements are placed so as to reach consumers based on various traits such as demographics, psychographics, behavioral variables (such as product purchase history), and firmographic variables ... or other second-order activities which serve as a proxy for these traits.
Most targeted new media advertising currently uses second-order proxies for targeting, such as tracking online or mobile web activities of consumers, associating historical webpage consumer demographics with new consumer web page access, using a search word as the basis for implied interest, or contextual advertising.
Addressable advertising systems serve ads directly based on demographic, psychographic, or behavioral attributes associated with the consumer(s) exposed to the ad. These systems are always digital and must be addressable in that the end point which serves the ad (set-top box, website, or digital sign) must be capable of rendering an ad independently of any other end points based on consumer attributes specific to that end point at the time the ad is served. Addressable advertising systems therefore must use consumer traits associated with the end points as the basis for selecting and serving ads." [Targeted advertising. Wikipedia]
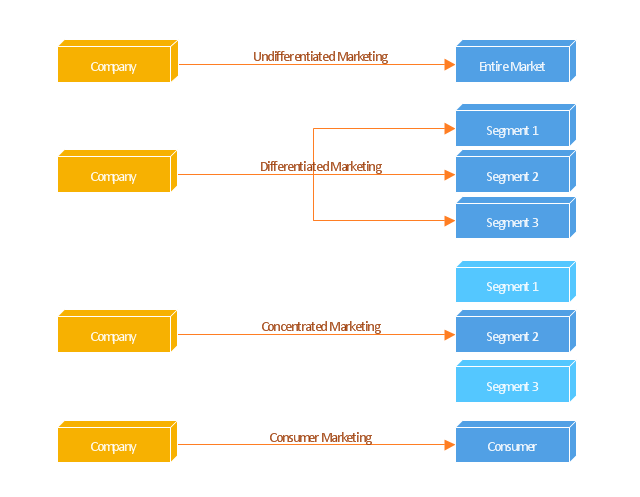
The block diagram example "Marketing targeting" was created using the ConceptDraw PRO diagramming and vector drawing software extended with the Block Diagrams solution from the area "What is a Diagram" of ConceptDraw Solution Park.
Most targeted new media advertising currently uses second-order proxies for targeting, such as tracking online or mobile web activities of consumers, associating historical webpage consumer demographics with new consumer web page access, using a search word as the basis for implied interest, or contextual advertising.
Addressable advertising systems serve ads directly based on demographic, psychographic, or behavioral attributes associated with the consumer(s) exposed to the ad. These systems are always digital and must be addressable in that the end point which serves the ad (set-top box, website, or digital sign) must be capable of rendering an ad independently of any other end points based on consumer attributes specific to that end point at the time the ad is served. Addressable advertising systems therefore must use consumer traits associated with the end points as the basis for selecting and serving ads." [Targeted advertising. Wikipedia]
The block diagram example "Marketing targeting" was created using the ConceptDraw PRO diagramming and vector drawing software extended with the Block Diagrams solution from the area "What is a Diagram" of ConceptDraw Solution Park.
Block diagram
Online Flow Chart

HelpDesk
How To Convert a Block Diagram to Adobe PDF

ConceptDraw Solution Park
ConceptDraw Solution Park collects graphic extensions, examples and learning materials
 Fault Tree Analysis Diagrams
This solution extends ConceptDraw PRO v9.5 or later with templates, fault tree analysis example, samples and a library of vector design elements for drawing FTA diagrams (or negative analytical trees), cause and effect diagrams and fault tree diagrams.
HelpDesk
How to Add a Block Diagram to a PowerPoint Presentation

Flow chart Example. Warehouse Flowchart


Functional Block Diagram

Simple Diagramming


 Cross-Functional Flowcharts
Cross-functional flowcharts are powerful and useful tool for visualizing and analyzing complex business processes which requires involvement of multiple people, teams or even departments. They let clearly represent a sequence of the process steps, the order of operations, relationships between processes and responsible functional units (such as departments or positions).
"Porter five forces analysis is a framework for industry analysis and business strategy development. It draws upon industrial organization (IO) economics to derive five forces that determine the competitive intensity and therefore attractiveness of a market. Attractiveness in this context refers to the overall industry profitability. An "unattractive" industry is one in which the combination of these five forces acts to drive down overall profitability. A very unattractive industry would be one approaching "pure competition", in which available profits for all firms are driven to normal profit.
Three of Porter's five forces refer to competition from external sources. The remainder are internal threats.
Porter referred to these forces as the micro environment, to contrast it with the more general term macro environment. They consist of those forces close to a company that affect its ability to serve its customers and make a profit. A change in any of the forces normally requires a business unit to re-assess the marketplace given the overall change in industry information. The overall industry attractiveness does not imply that every firm in the industry will return the same profitability. Firms are able to apply their core competencies, business model or network to achieve a profit above the industry average. A clear example of this is the airline industry. As an industry, profitability is low and yet individual companies, by applying unique business models, have been able to make a return in excess of the industry average.
Porter's five forces include - three forces from 'horizontal' competition: the threat of substitute products or services, the threat of established rivals, and the threat of new entrants; and two forces from 'vertical' competition: the bargaining power of suppliers and the bargaining power of customers.
This five forces analysis, is just one part of the complete Porter strategic models. The other elements are the value chain and the generic strategies." [Porter five forces analysis. Wikipedia]
The block diagram example "Porter's five forces model" was created using the ConceptDraw PRO diagramming and vector drawing software extended with the Block Diagrams solution from the area "What is a Diagram" of ConceptDraw Solution Park.
Block diagram

Swim Lane Diagrams

Flow Diagrams

- Online Software Draw Block Diagrams
- UML Component Diagram Example - Online Shopping | UML Tool ...
- Block Daigram Of Online Business System
- Credit Card Online Payment System Block Diagram
- Online Decision Making Process Block Diagrams
- UML Component Diagram Example - Online Shopping | Example of ...
- Example of DFD for Online Store (Data Flow Diagram ) DFD ...
- State Diagram Example - Online Store | Example of DFD for Online ...
- Data Flow Diagram Model
- UML Component Diagram Example - Online Shopping | UML Class ...
- Store Layout Software | Example of DFD for Online Store (Data Flow ...
- UML Component Diagram Example - Online Shopping | UML Tool ...
- Flow Chart Online | State Diagram Example - Online Store | Process ...
- Online Shopping System In Software Engineering Er Diagram
- UML Component Diagram Example - Online Shopping | Example of ...
- Online Furniture Shopping E R Diagram
- UML Component Diagram Example - Online Shopping | UML ...
- Process Flowchart | Example of DFD for Online Store (Data Flow ...
- Free Online Tool For Block Diagram
- ConceptDraw Solution Park | How To Convert a Block Diagram to ...