Examples of Flowcharts, Org Charts and More


Business Diagram Software


Network Diagram Software. LAN Network Diagrams. Physical Office Network Diagrams


HelpDesk
How to Draw a Chemical Process Flow Diagram

Diagram of a Basic Computer Network. Computer Network Diagram Example

HelpDesk
How to Create a Computer Network Diagram

HelpDesk
How to Create a Sales Flowchart

HelpDesk
How to Create an Accounting Flowchart

HelpDesk
How to Create a Data Flow Diagram

HelpDesk
How to Create a HR Process Flowchart

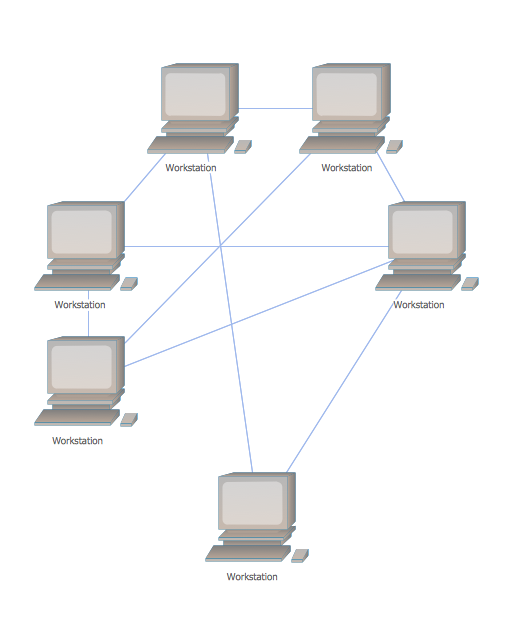
Mesh Network Topology Diagram
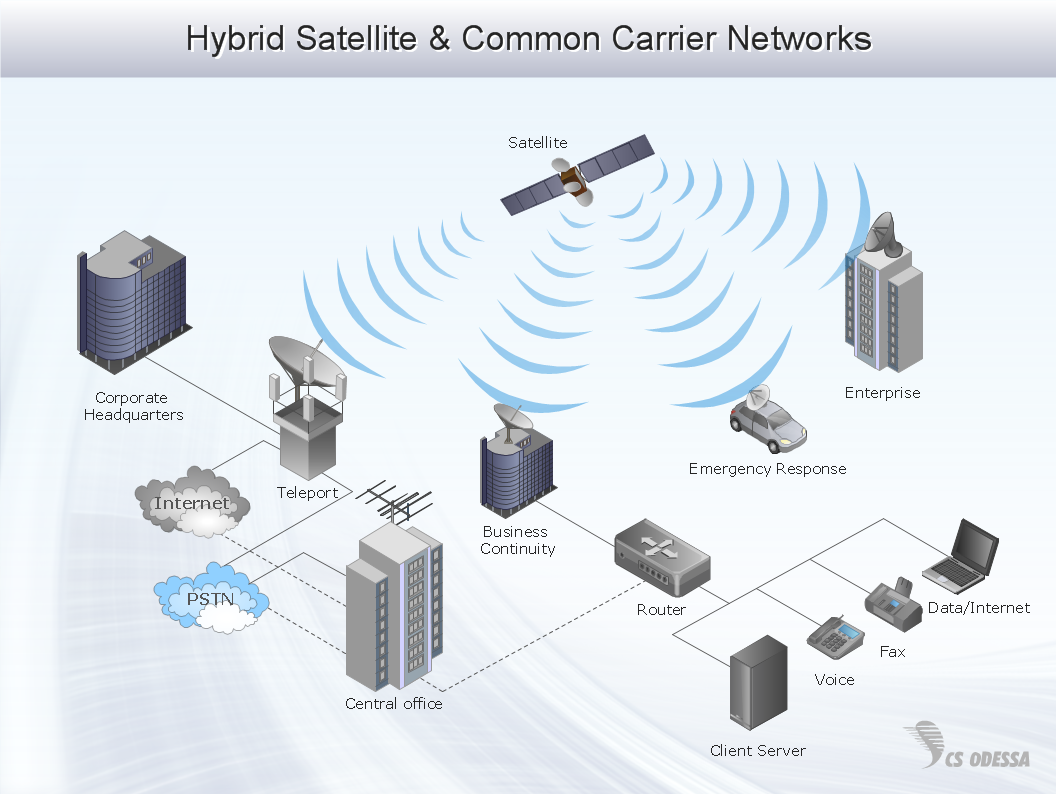
Network Diagram Software Enterprise Private Network
HelpDesk
How to Create Flowchart Using Standard Flowchart Symbols

HelpDesk
How To Create MS Visio Cross-Functional Flowchart

- How to Draw a Computer Network Diagrams | Process Flowchart ...
- Process Flowchart | Flowchart Software | Network Diagramming with ...
- Storage area networks (SAN). Computer and Network Examples ...
- Wireless Network Flow Diagram
- Basic Flowchart Symbols and Meaning | Local area network (LAN ...
- Network Management Functional Flowchart
- Mobile Satellite Flowchart
- Computer Network Diagrams | Telecommunication Network ...
- Active Directory Flow Chart Sample
- Mesh Network Topology Diagram | Fully Connected Network ...
- Telecommunication Network Diagrams | Process Flowchart | Design ...
- Physical LAN and WAN diagram - Template | Network Diagram ...
- Wireless Networks | How to Create a Wireless Network Diagram ...
- Flow Chart The Simple Computer Network Systems
- Process Flowchart | How to Draw a Computer Network Diagrams ...
- Process Flowchart | Hotel Network Topology Diagram | Hotel ...
- Telecommunication Network Diagrams | How To Create a MS Visio ...
- Process Flowchart | Network Diagram Software LAN Network ...
- Basic Flowchart Symbols and Meaning | Network Diagram Software ...
- Activity Network (PERT) Chart | Flow chart Example. Warehouse ...