This site uses cookies. By continuing to browse the ConceptDraw site you are agreeing to our Use of Site Cookies.

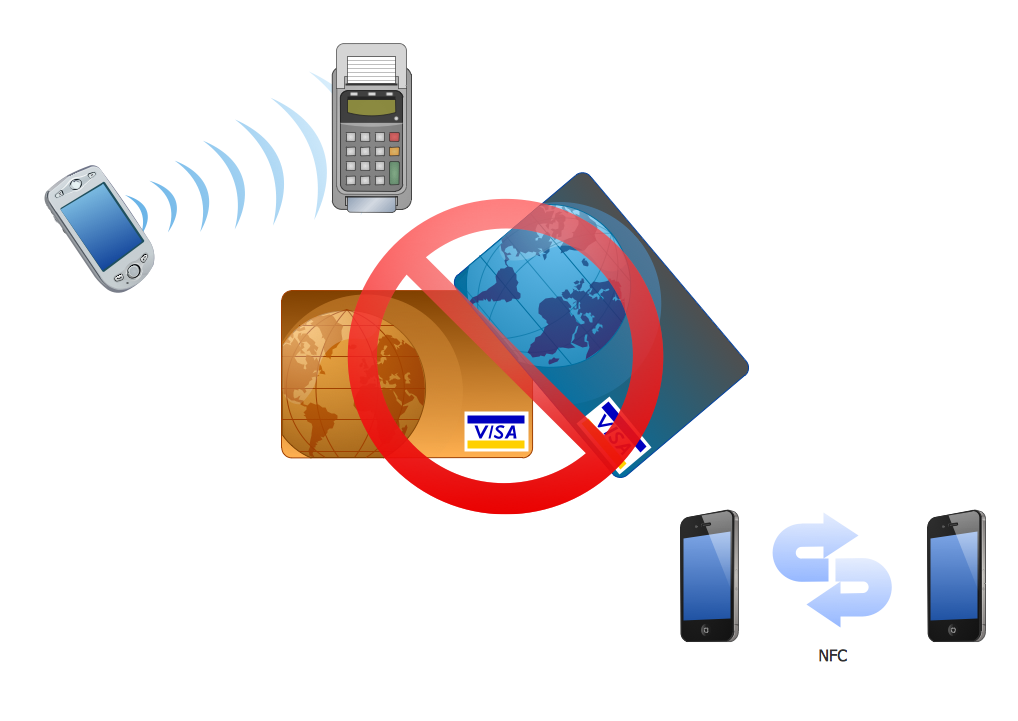
Near field communication (NFC). Computer and Network Examples

Near field communication (NFC) is a wireless communication technology that allows smartphones and other similar devices to establish the radio communication with each other on the short distance around 10 centimeters (4 inches).
This example was created in ConceptDraw DIAGRAM using the Computer and Networks Area of ConceptDraw Solution Park and shows the Near field communication (NFC) network.

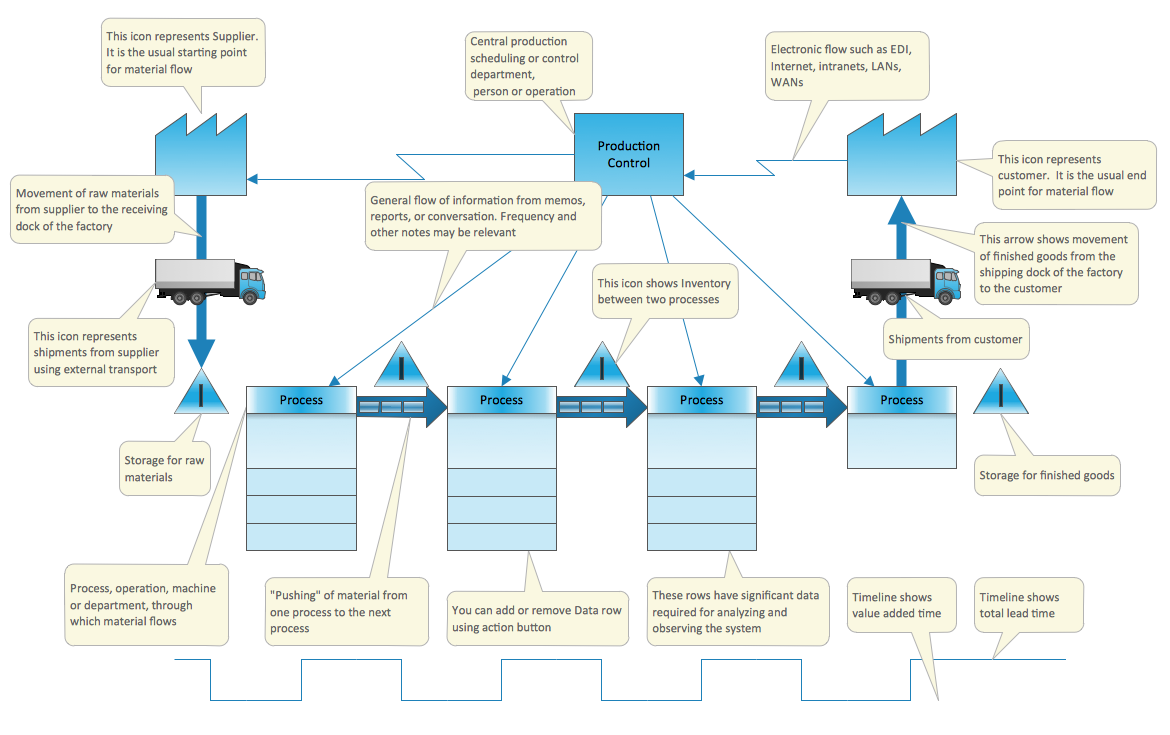
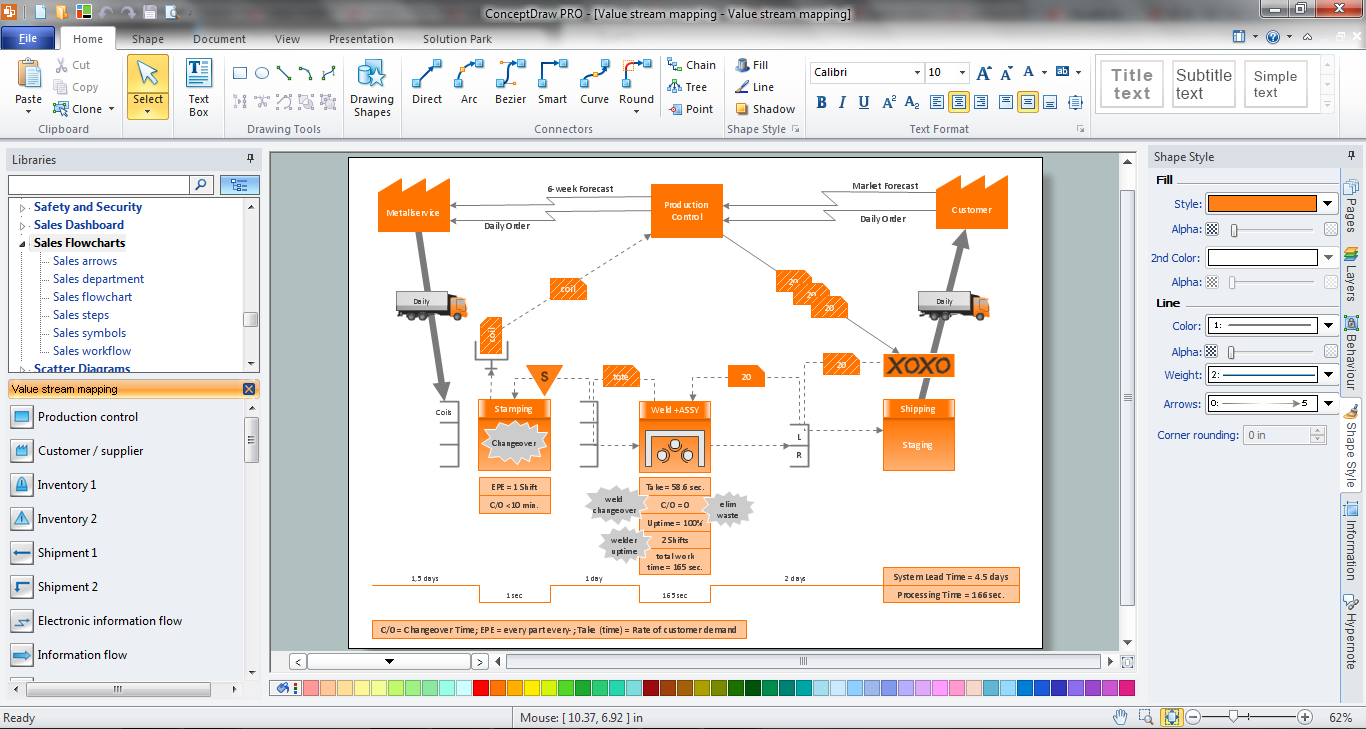
Create a Value Stream Map Rapidly

The Value Stream Mapping solution from ConceptDraw Solution Park extends ConceptDraw DIAGRAM software with a new library that contains vector objects, samples and templates.
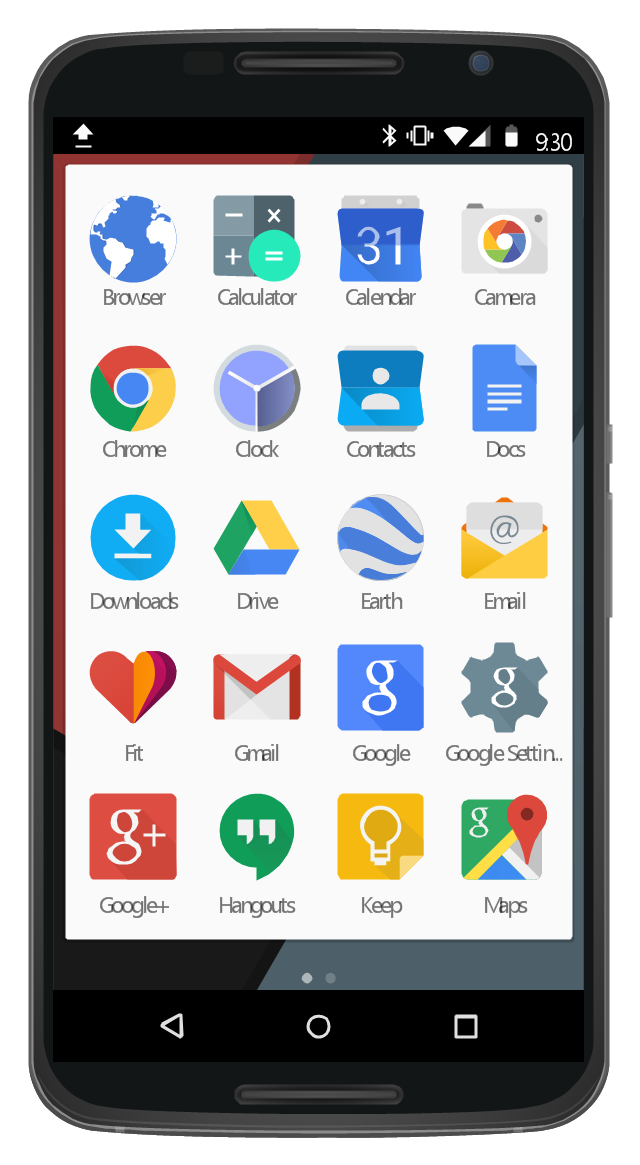
This UI design example shows common icons of Android applications on the App Drawer screen of Google Nexus 6 smartphone.
The user interface design example "Android 5.0 - App drawer" was created using the ConceptDraw PRO diagramming and vector drawing software extended with the "Android user interface" solution from the "Software Development" area of ConceptDraw Solution Park.
App Drawer UI
App Drawer UI, vibration icon, status bar, signal wifi 4 bar icon, signal cellular 3 bar icon, page control, navigation bar, file upload icon, dimmed background, cards, bluetooth icon, battery 80 icon, app icon text label, Settings Google icon, Nexus 6, Maps icon, Keep icon, Hangouts icon, Google plus icon, Google icon , Gmail icon, Fit icon, Email icon, Earth icon, Drive icon, Downloads icon, Docs icon, Contacts icon, Clock icon, Chrome icon, Camera icon, Calendar icon, Calculator icon, Browser icon, Android wallpapers,
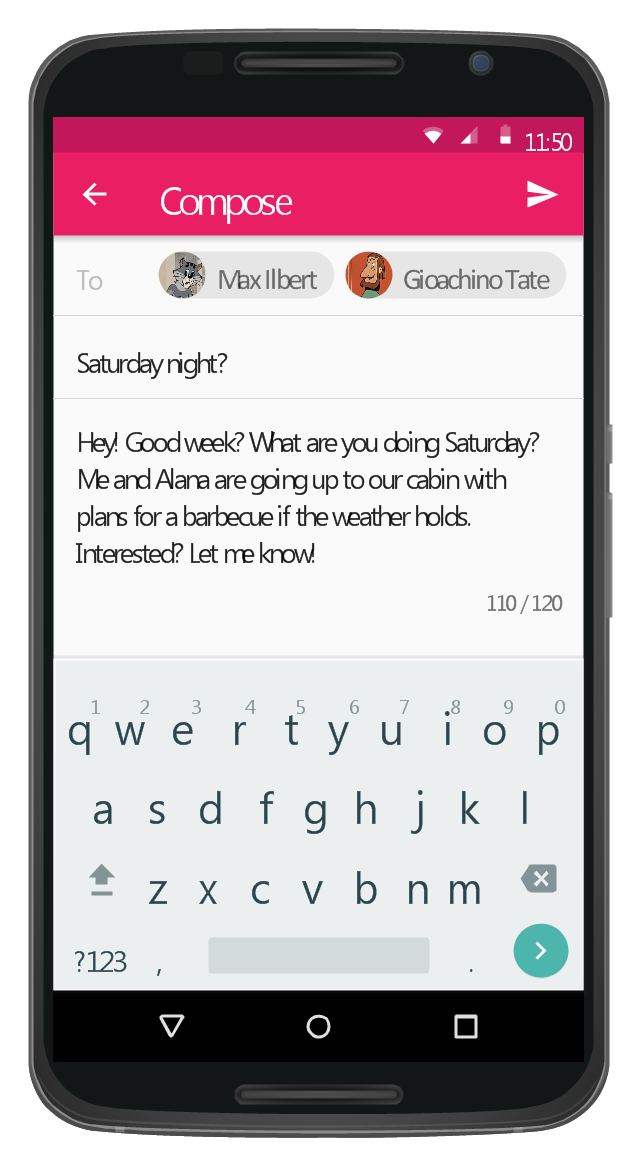
This Android 5 UI design example shows Gmail screen of Google Nexus 6 smartphone.
The user interface design example "Android 5.0 - Gmail" was created using the ConceptDraw PRO diagramming and vector drawing software extended with the "Android user interface" solution from the "Software Development" area of ConceptDraw Solution Park.
Gmail screen
Gmail screen, status bar, signal wifi statusbar 3 bar, status bar icon, signal cellular 2 bar, send icon, navigation bar, menu icon, keyboard, full-width text field, character counter, full-width text field, closed contact chip, chevron right icon, battery, backspace, arrow back icon, app bar, Nexus 6,

Value Stream Diagram

The new Value Stream Mapping solution found in the ConceptDraw Solution Park continues to extend the range of ConceptDraw DIAGRAM into a business graphics tool.

Sections of the Value Stream Map

The Value Stream Mapping solution extends ConceptDraw DIAGRAM software with a new library that contain vector objects, samples and templates.

Cause and Effect Diagram

ConceptDraw DIAGRAM software extended with Fishbone Diagrams solution from the Management area of ConceptDraw Solution Park is perfect for Cause and Effect Diagram creating. It gives the ability to draw fishbone diagram that identifies many possible causes for an effect or a problem. Causes and Effects are usually grouped into major categories to identify these sources of variation. Causes and Effects in the diagram show relationships among various factor. Fishbone diagram shows factors of Equipment, Process, People, Materials, Environment and Management, all affecting the overall problem.

Value Stream Mapping

Use ConceptDraw Value Stream Maps (VSM) visualization for a manufacturing plant the material and information flow required to deliver a product/service to customers. The new Value Stream Mapping solution found in the ConceptDraw Solution Park continues to extend the range of ConceptDraw DIAGRAM into a business graphics tool that can be used to document processes in any organization.

Value Stream Analysis

ConceptDraw Value Stream Maps are used in lean practice for analysis of manufacturing processes to identify the improvement opportunities.

What is Value Stream Mapping?

Value stream maps (VSM) are an essential tool for organizations applying Lean methods.