 iPhone User Interface
iPhone User Interface solution extends ConceptDraw DIAGRAM software with templates, samples and libraries with large quantity of vector stencils of graphical user interface elements, Apps icons, UI patterns for designing and prototyping of the iOS applic
Computer Network Architecture. Computer and Network Examples

Cisco Products Additional. Cisco icons, shapes, stencils and symbols
 Audio and Video Connectors
Audio and video connectors solution extends ConceptDraw DIAGRAM software with templates, samples and library of vector stencils for drawing audio and video hook up diagrams.
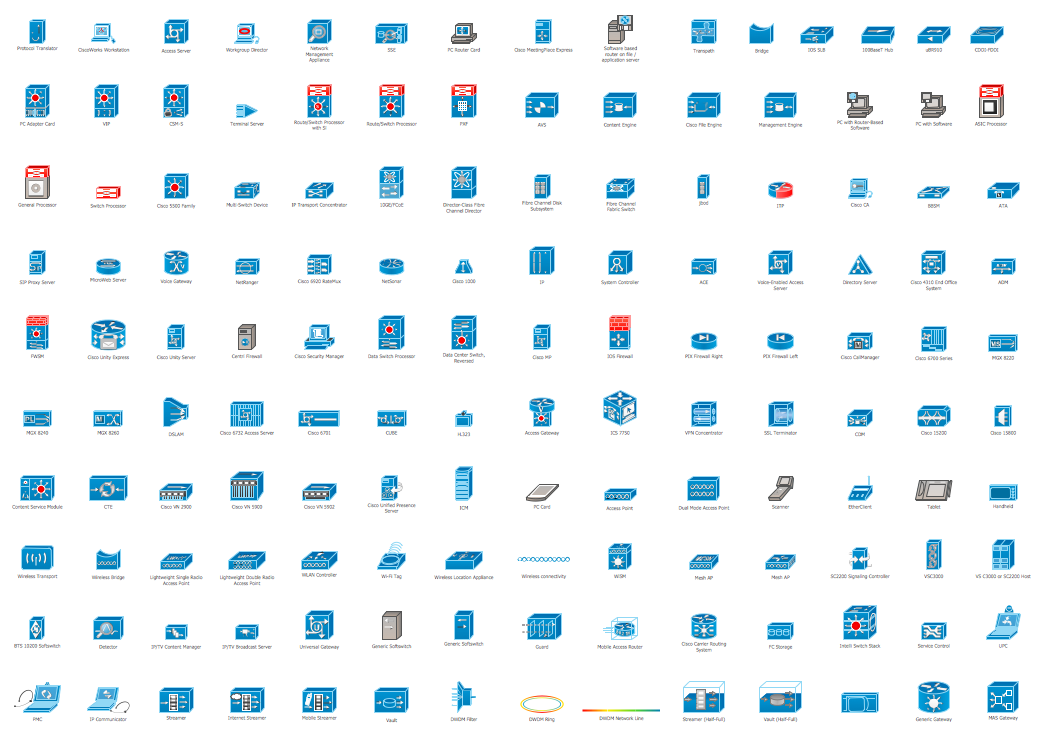
The vector stencils library "Telecom" contains 20 telecommunication icons. Use it to design your IT and telecom illustrations and infographics with ConceptDraw PRO diagramming and vector drawing software.
"Telecommunication is the transmission of signs, signals, writings, images and sounds or intelligence of any nature by wire, radio, optical or other electromagnetic systems, as defined by the International Telecommunication Union (ITU).
Telecommunication occurs when the exchange of information between communication participants includes the use of technology. It is transmitted either electrically over physical media, such as cables, or via electromagnetic radiation. Such transmission paths are often divided into communication channels which afford the advantages of multiplexing. ...
Modern technologies for long-distance communication usually involve electrical and electromagnetic technologies, such as telegraph, telephone, and teleprinter, networks, radio, microwave transmission, fiber optics, and communications satellites." [Telecommunication. Wikipedia]
The telecommunication icon set example "Design elements - Telecom" is included in the Computers and Communications solution from the Illustration area of ConceptDraw Solution Park.
Telecommunication icon set
 ConceptDraw Solution Park
ConceptDraw Solution Park collects graphic extensions, examples and learning materials
ERD Symbols and Meanings


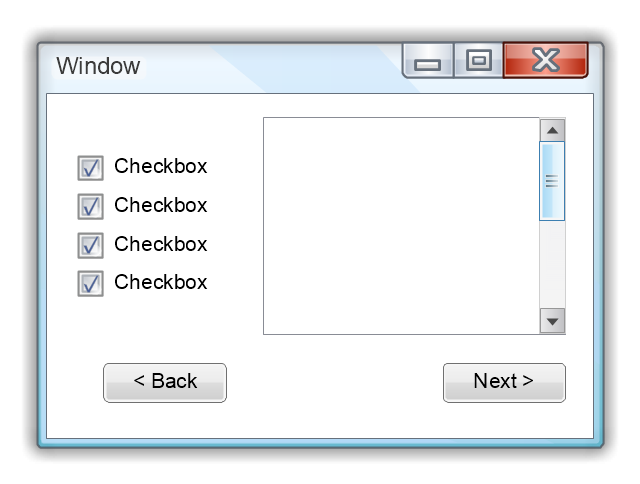
Use this template to prototype and design the Windows graphic user interface.
"In human–computer interaction, WIMP stands for "windows, icons, menus, pointer", denoting a style of interaction using these elements of the user interface. ... Other expansions are sometimes used, substituting "mouse" and "mice" or "pull-down menu" and "pointing", for menus and pointer, respectively. ...
In a WIMP system:
(1) A window runs a self-contained program, isolated from other programs that (if in a multi-program operating system) run at the same time in other windows.
(2) An icon acts as a shortcut to an action the computer performs (e.g., execute a program or task).
(3) A menu is a text or icon-based selection system that selects and executes programs or tasks.
(4) The pointer is an onscreen symbol that represents movement of a physical device that the user controls to select icons, data elements, etc.
(5) cut, copy, and paste.
This style of system improves human–computer interaction (HCI) by emulating real-world interactions and providing better ease of use for non-technical people - both novice and power users. Users can carry skill at a standardized interface from one application to another.
Due to the nature of the WIMP system, simple commands can be chained together to undertake a group of commands that would have taken several lines of command line instructions." [WIMP (computing). Wikipedia]
The Windows Vista graphic user interface template for the ConceptDraw PRO diagramming and vector drawing software is included in the Graphic User Interface solution from the Software Development area of ConceptDraw Solution Park.
Windows GUI template
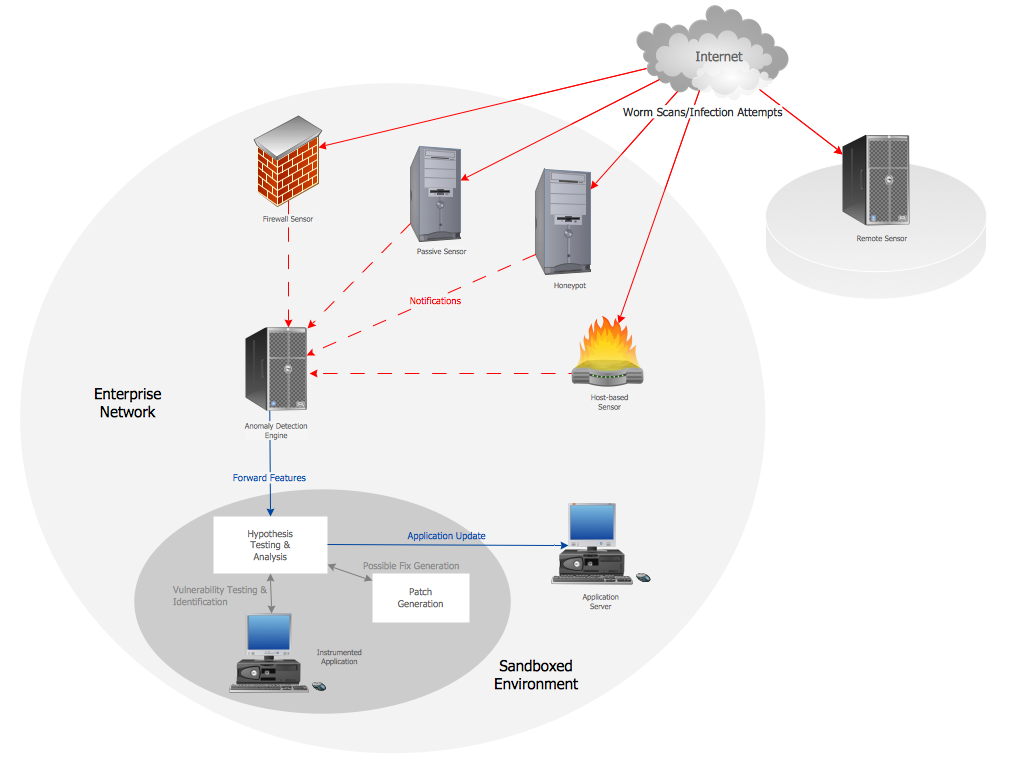
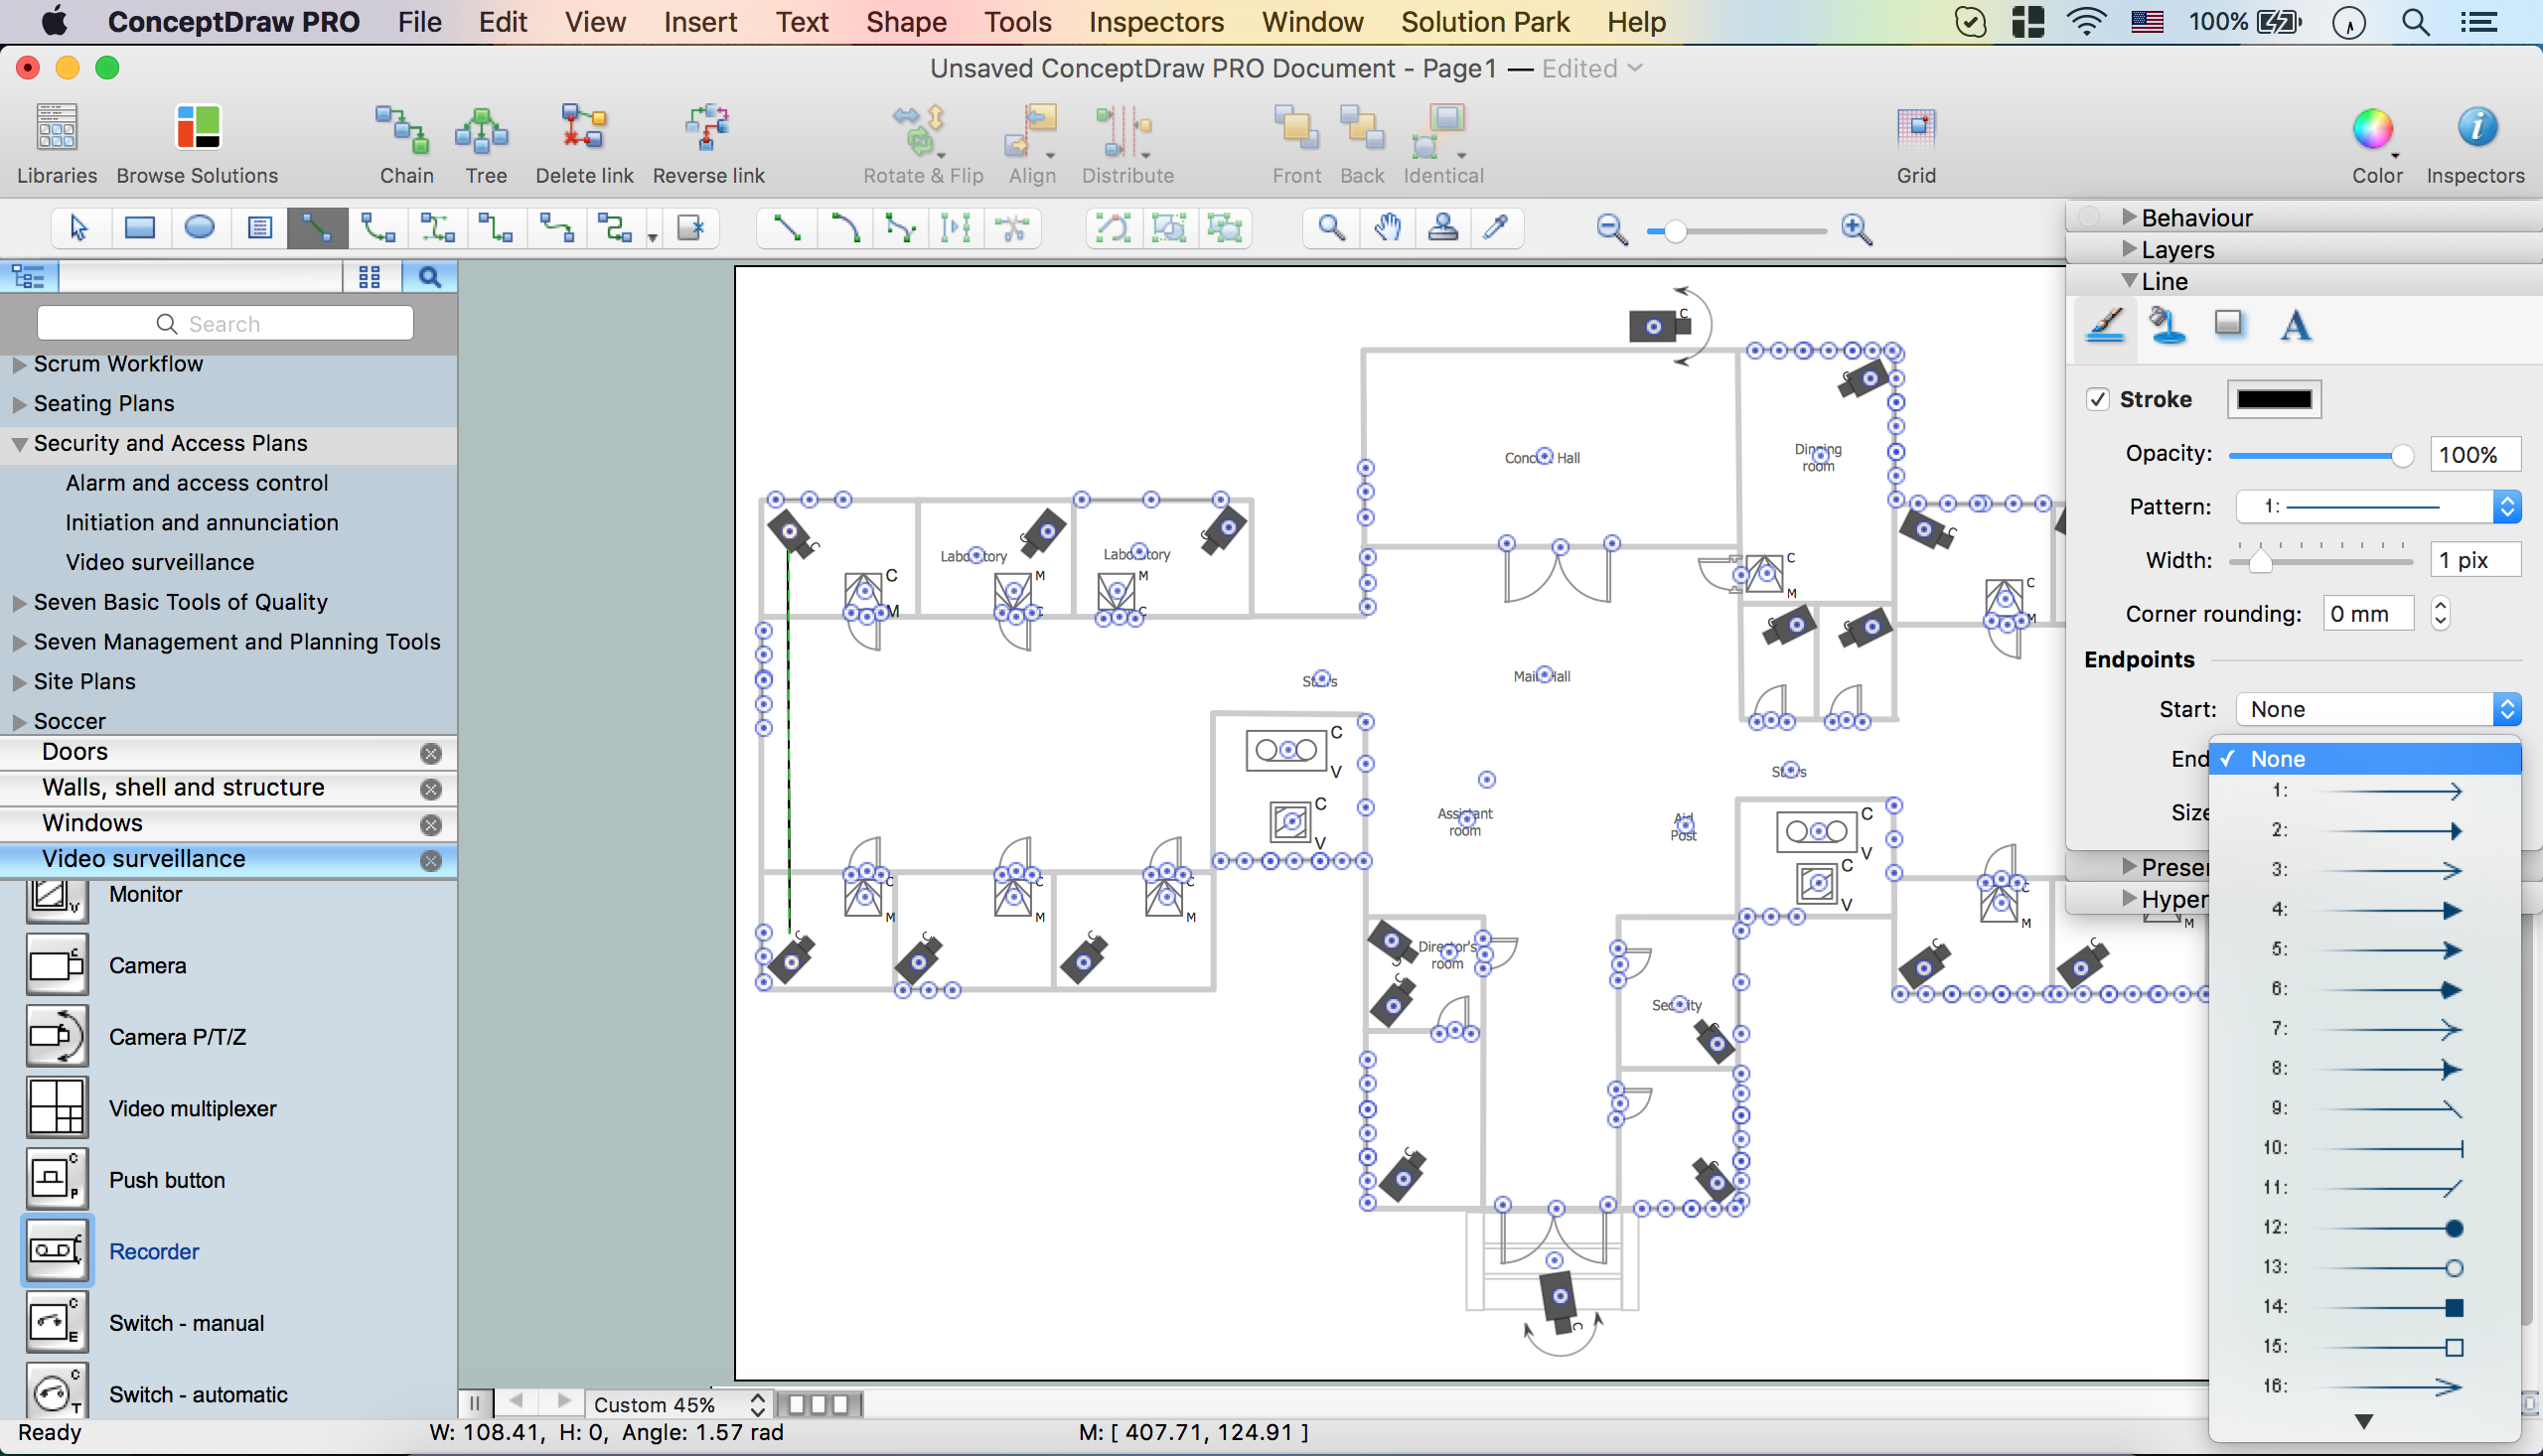
How To Create CCTV Network Diagram
 Cisco Network Diagrams
Cisco Network Diagrams solution extends ConceptDraw DIAGRAM with the best characteristics of network diagramming software. Included samples, templates and libraries of built-in standardized vector Cisco network icons and Cisco symbols of computers, network devices, network appliances and other Cisco network equipment will help network engineers, network designers, network and system administrators, as well as other IT professionals and corporate IT departments to diagram efficiently the network infrastructure, to visualize computer networks topologies, to design Cisco computer networks, and to create professional-looking Cisco Computer network diagrams, Cisco network designs and schematics, Network maps, and Network topology diagrams in minutes.
Entity Relationship Diagram Examples

ATM Solutions
The vector stencils library "Ecology pictograms" contains 20 icons of eco symbols. Use it to draw your ecological infographics. The example "Ecology pictograms - Vector stencils library" was created using the ConceptDraw PRO diagramming and vector drawing software extended with the Pictorial infographics solution from the area "What is infographics" in ConceptDraw Solution Park.
Recycle
Nature

Flower

Butterfly
Earth

Raindrop

Water supply
Eco house

Green home

Electric

Electric lamp

Energy saving bulb

Factory
Power plant
Battery
Bio fuel

Wind turbine
Solar power

Eco

Human footprint

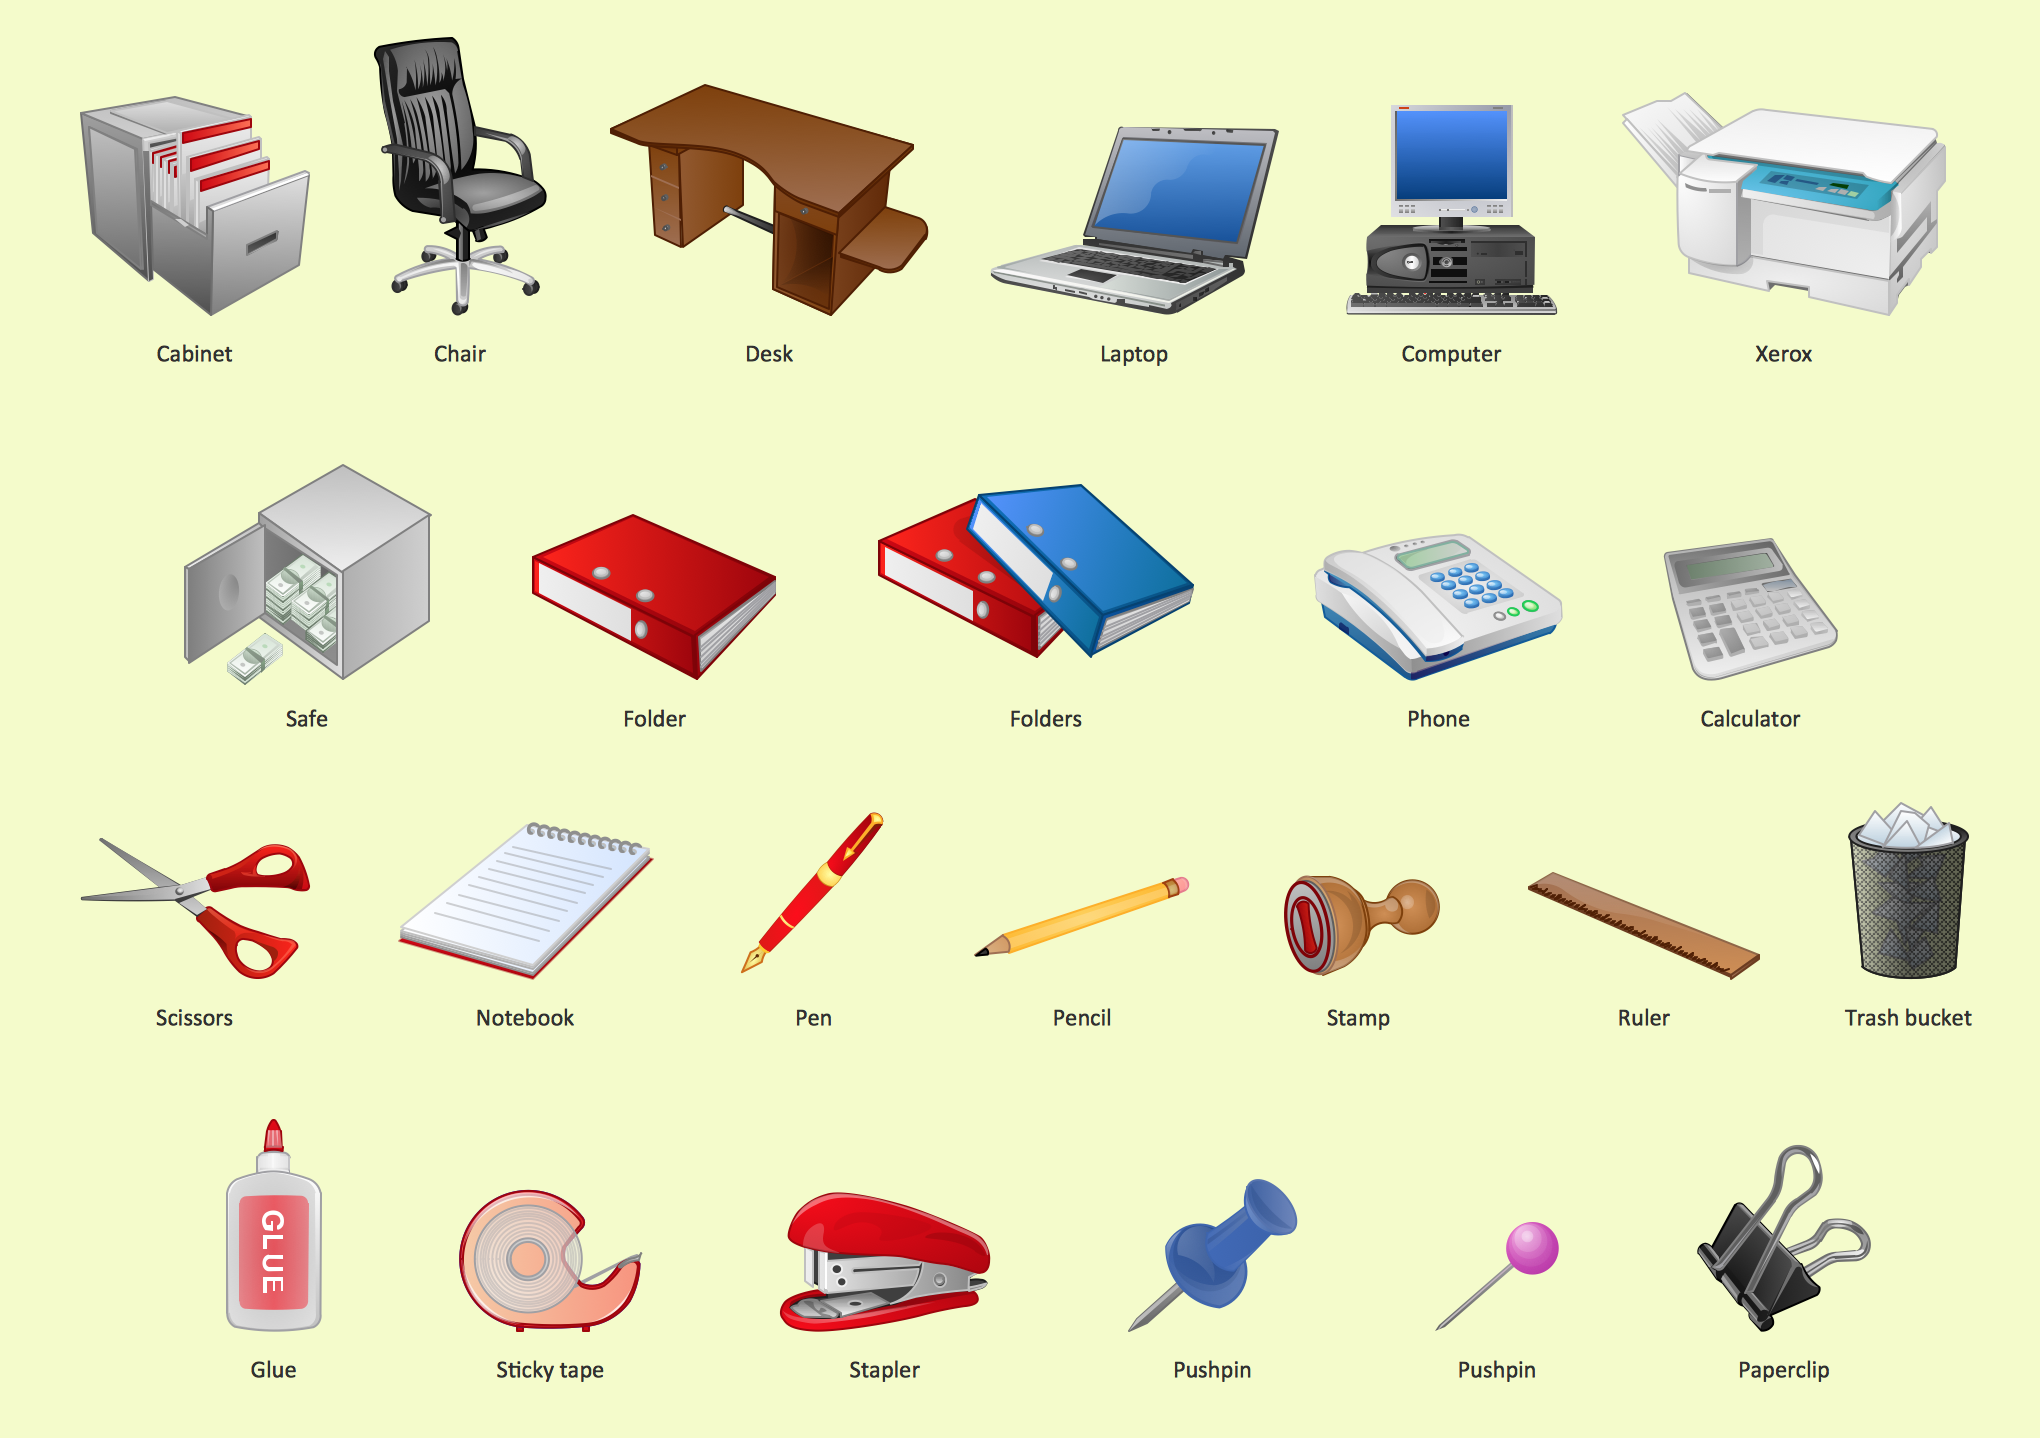
Office - Design Elements
How to Create a Column Chart

- Png Nature
- Natural Element Symbol Png
- Laboratory equipment - Vector stencils library | Gas Burner Icon Png
- Animals - Vector stencils library | Camel Png Icon
- Hill Vector Icon Png
- How can you illustrate the weather condition | Beauty in nature ...
- Design elements - Web Widgets | Drawing a Nature Scene | Process ...
- Wind Power Png
- Road transport - Vector stencils library | Traffic Cars Icon Type Png
- Manufacturing Icon Png
- Dog Png
- Architectural North Sign Png Image
- Mountain Vector Png
- Wind Weather Png
- River Image Png
- Bus Icon Png
- Water cycle diagram | Drawing a Nature Scene | Beauty in nature ...
- Mountain Vector Symbol Png
- Military Icon Png
- Png Black Animals