HelpDesk
How to Deliver a Presentation on Mac Using Two Monitors

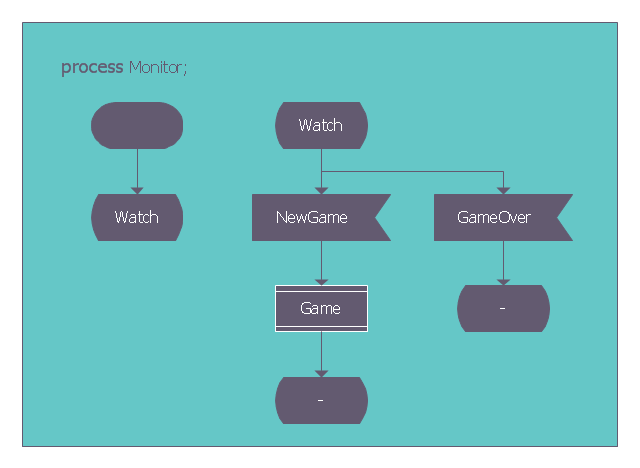
This SDL diagram example was redesigned from the Wikimedia Commons file: SDL processMonitor.png.
"Diagram of the process Monitor in SDL (Specification and Description Language)." [commons.wikimedia.org/ wiki/ File:SDL_ processMonitor.png]
This file is made available under the Creative Commons CC0 1.0 Universal Public Domain Dedication. [creativecommons.org/ publicdomain/ zero/ 1.0/ deed.en]
The diagram example "SDL process Monitor" was created using the ConceptDraw PRO diagramming and vector drawing software extended with the Specification and Description Language (SDL) solution from the Engineering area of ConceptDraw Solution Park.
SDL diagram example
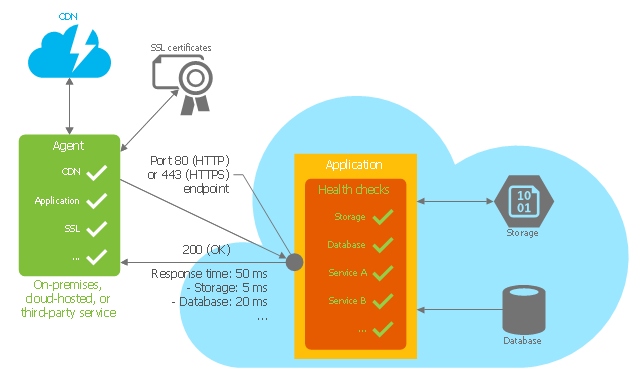
This Azure cloud architecture pattern diagram template was created on the base of figure in the article "Health Endpoint Monitoring Pattern" from the Microsoft Developer Network (MSDN) website.
"Health Endpoint Monitoring Pattern.
Implement functional checks within an application that external tools can access through exposed endpoints at regular intervals. This pattern can help to verify that applications and services are performing correctly. ...
It is good practice—and often a business requirement—to monitor web applications, and middle-tier and shared services, to ensure that they are available and performing correctly. However, it is more difficult to monitor services running in the cloud than it is to monitor on-premises services. ...
Implement health monitoring by sending requests to an endpoint on the application. The application should perform the necessary checks, and return an indication of its status.
A health monitoring check typically combines two factors: the checks (if any) performed by the application or service in response to the request to the health verification endpoint, and analysis of the result by the tool or framework that is performing the health verification check. The response code indicates the status of the application and, optionally, any components or services it uses. The latency or response time check is performed by the monitoring tool or framework." [msdn.microsoft.com/ ru-RU/ library/ dn589789.aspx]
The Azure cloud system architecture diagram template "Health endpoint monitoring pattern" for the ConceptDraw PRO diagramming and vector drawing software is included in the Azure Architecture solutin from the Computer and Networks area of ConceptDraw Solution Park.
Cloud computing system architecture diagram template
The vector stencils library "Rack diagrams" contains 33 rack design elements for drawing the computer network server rack diagrams.
"A 19-inch rack is a standardized frame or enclosure for mounting multiple equipment modules. Each module has a front panel that is 19 inches (482.6 mm) wide, including edges or ears that protrude on each side which allow the module to be fastened to the rack frame with screws. ...
Equipment designed to be placed in a rack is typically described as rack-mount, rack-mount instrument, a rack mounted system, a rack mount chassis, subrack, rack mountable, or occasionally simply shelf. The height of the electronic modules is also standardized as multiples of 1.75 inches (44.45 mm) or one rack unit or U (less commonly RU). The industry standard rack cabinet is 42U tall. ...
19-inch racks in 2-post or 4-post form hold most equipment in modern data centers, ISP facilities and professionally designed corporate server rooms. They allow for dense hardware configurations without occupying excessive floorspace or requiring shelving." [19-inch rack. Wikipedia]
The clip art example "Rack diagrams - Vector stencils library" was created using the ConceptDraw PRO diagramming and vector drawing software extended with the Rack Diagrams solution from the Computer and Networks area of ConceptDraw Solution Park.
19 inch Rack with Rails
Rack
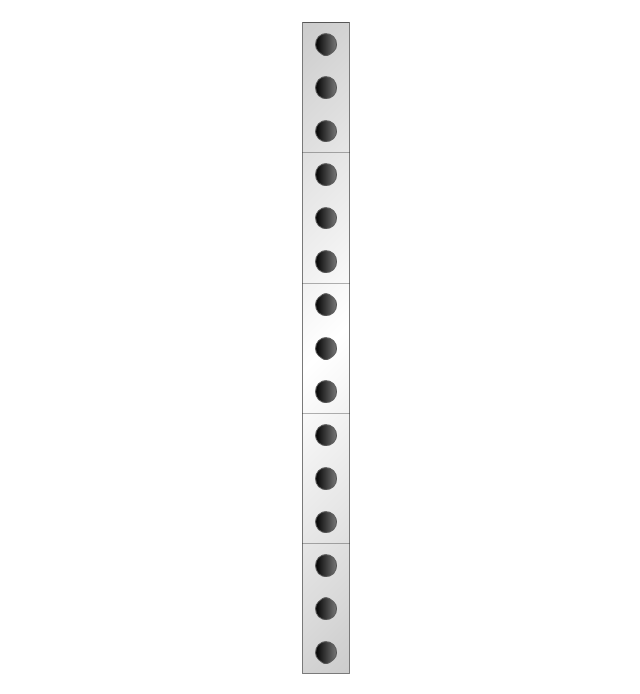
Rack rails
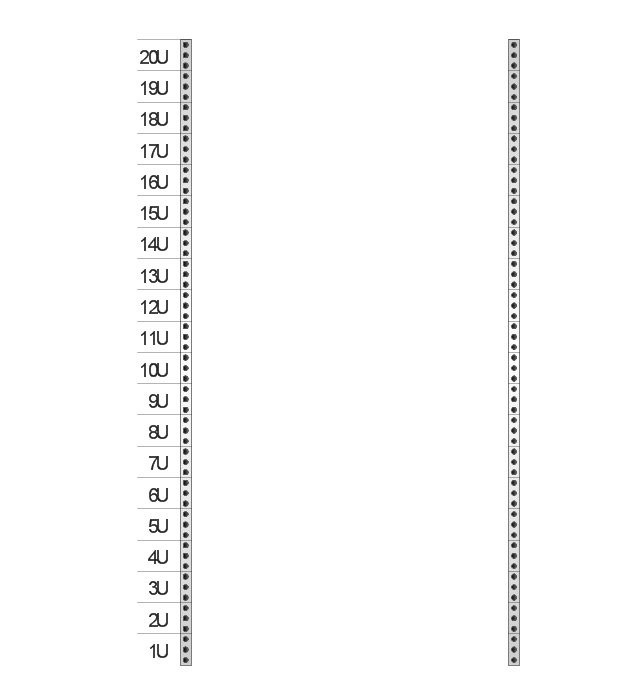
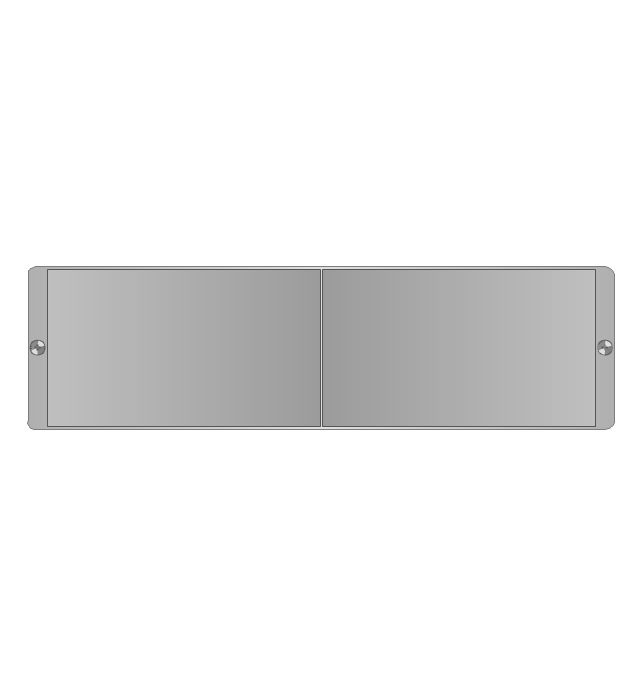
Rack rails (half-width)
-rack-diagrams---vector-stencils-library.png--diagram-flowchart-example.png)
Single rack rail
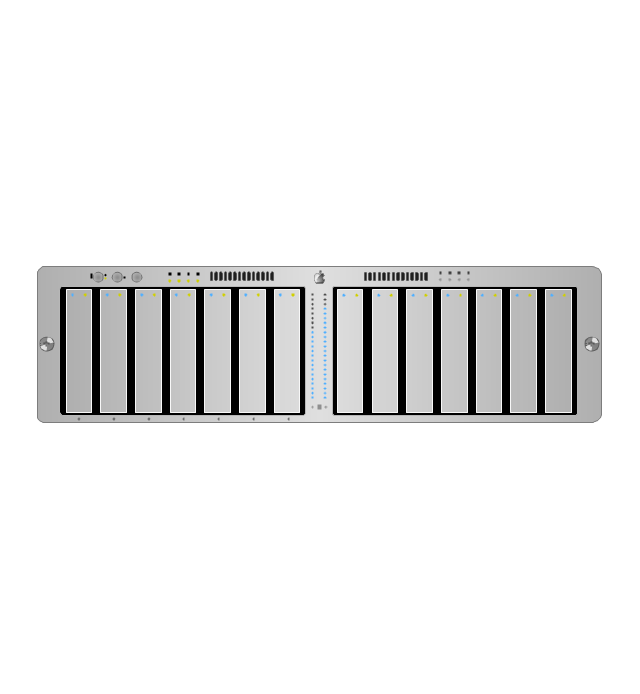
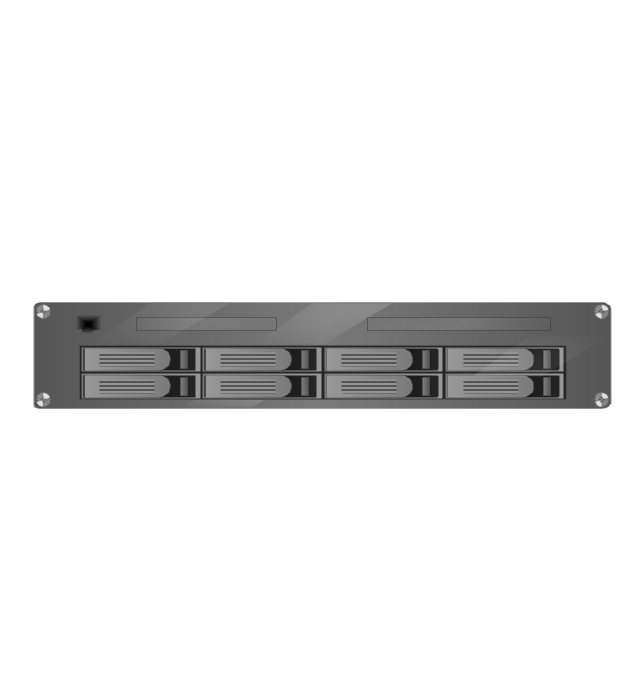
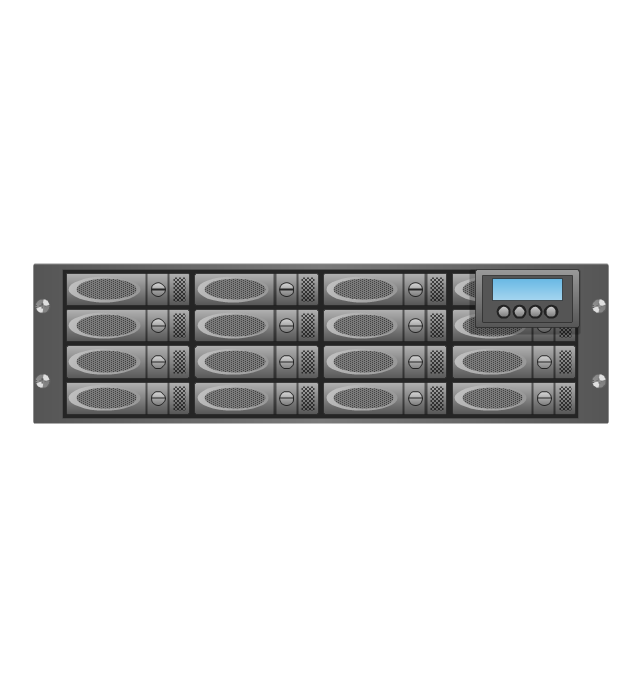
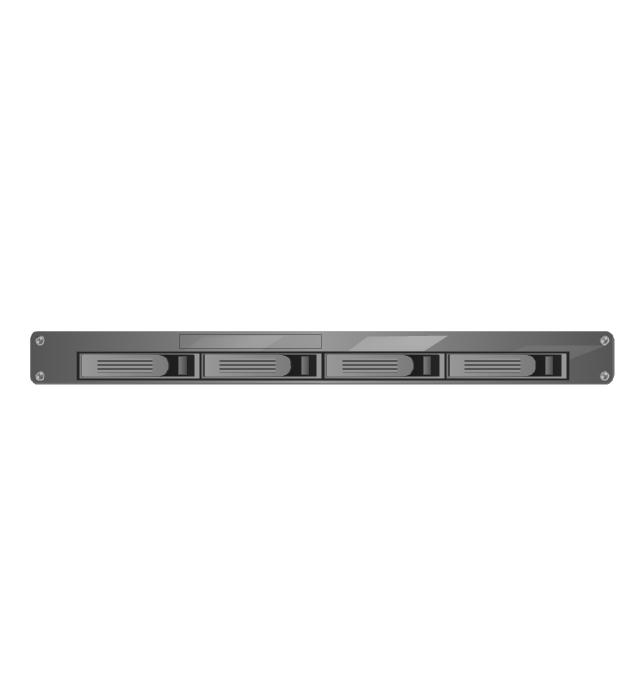
Xserve RAID
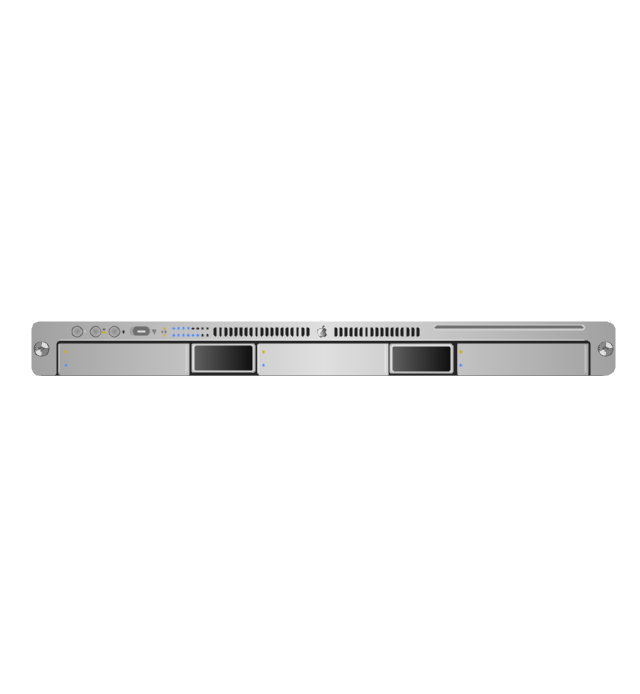
XServe
1U tray

1U spacer

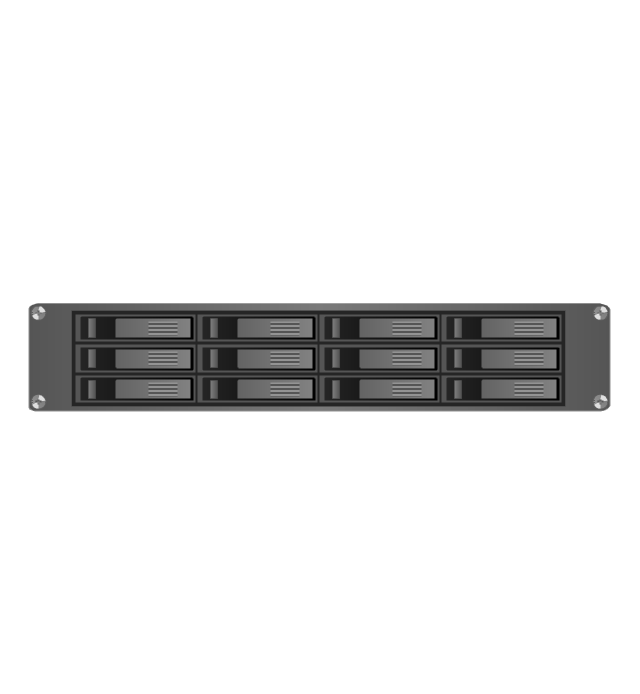
2U server
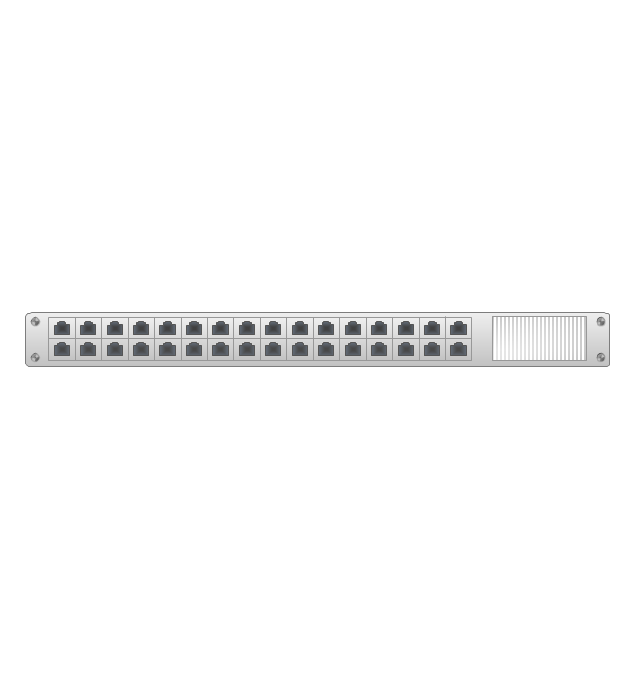
1U Ethernet Switch/Hub
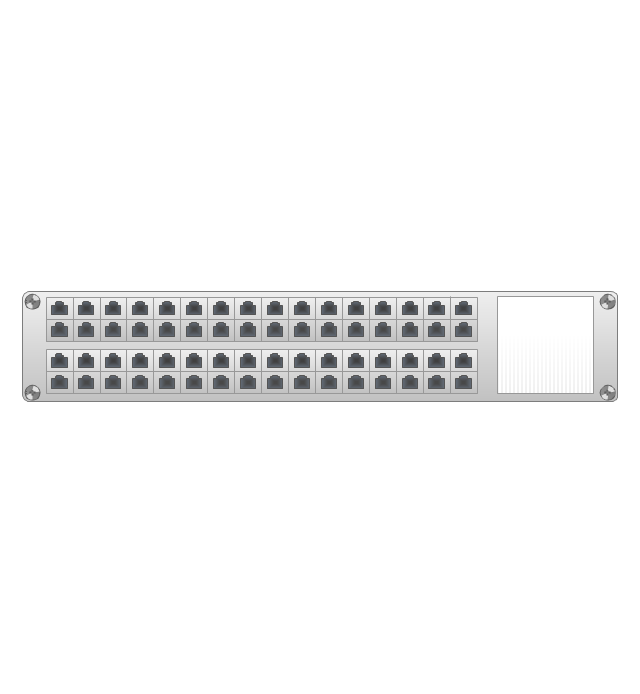
2U Ethernet Switch/Hub
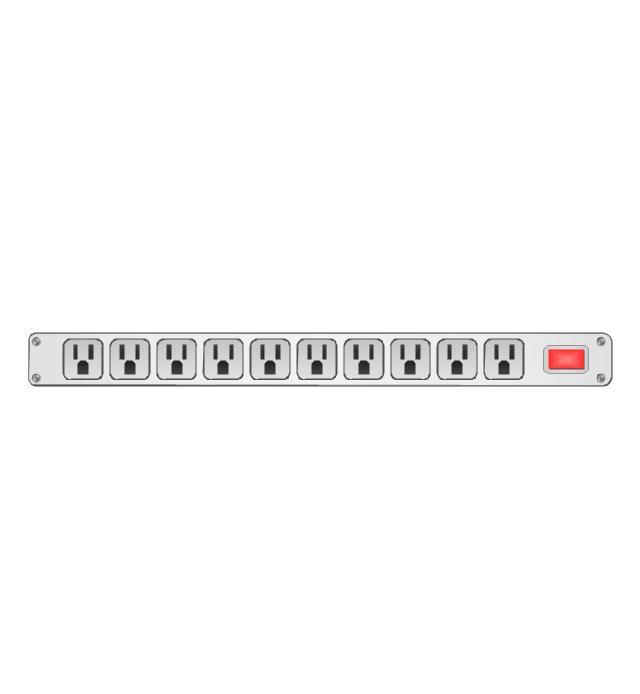
1U power strip
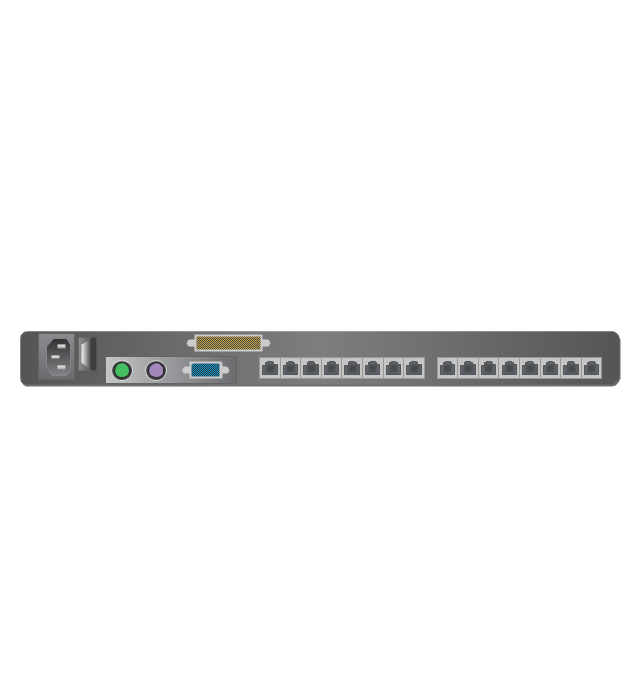
1U KVM switch
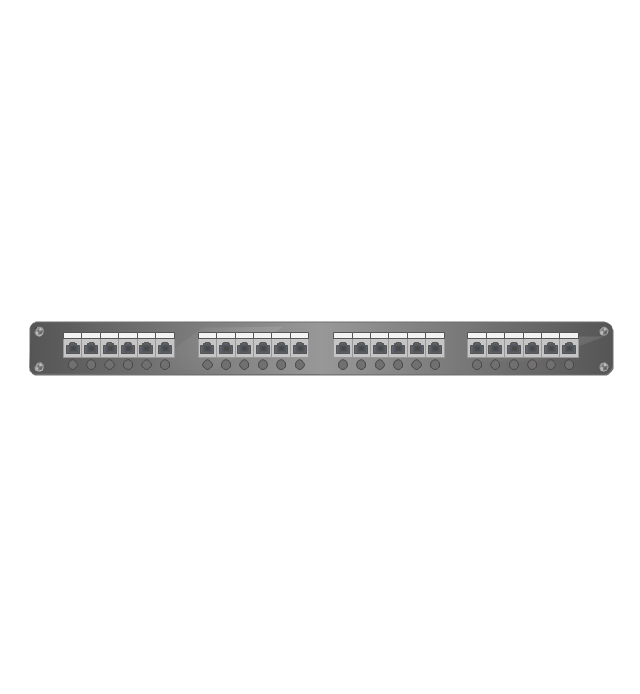
1U patch panel
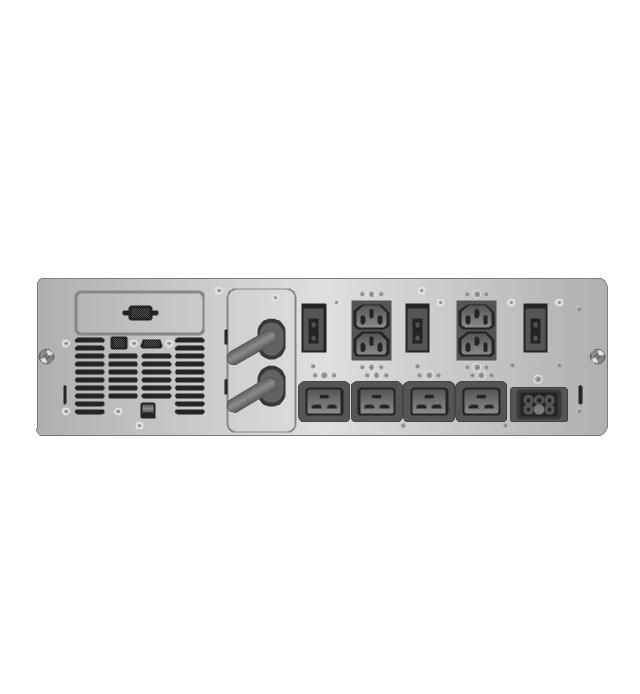
Rackmount UPS
Cisco switch (WS-C3560-24PS-S)
-rack-diagrams---vector-stencils-library.png--diagram-flowchart-example.png)
Cisco switch (WS-C3560-48TS-S)
-rack-diagrams---vector-stencils-library.png--diagram-flowchart-example.png)
Cisco switch (WS-C2960-48TT-L)
-rack-diagrams---vector-stencils-library.png--diagram-flowchart-example.png)
Cisco switch (WS-C2960-48TC-L)
-rack-diagrams---vector-stencils-library.png--diagram-flowchart-example.png)
Cisco switch (WS-C2960-24TT-L)
-rack-diagrams---vector-stencils-library.png--diagram-flowchart-example.png)
Cisco switch (WS-C2960-24TC-L)
-rack-diagrams---vector-stencils-library.png--diagram-flowchart-example.png)
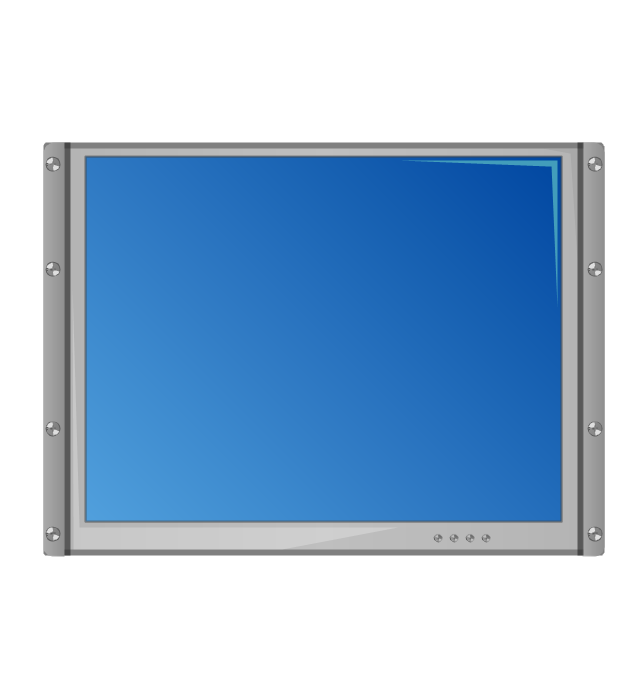
7U rackmount LCD monitor
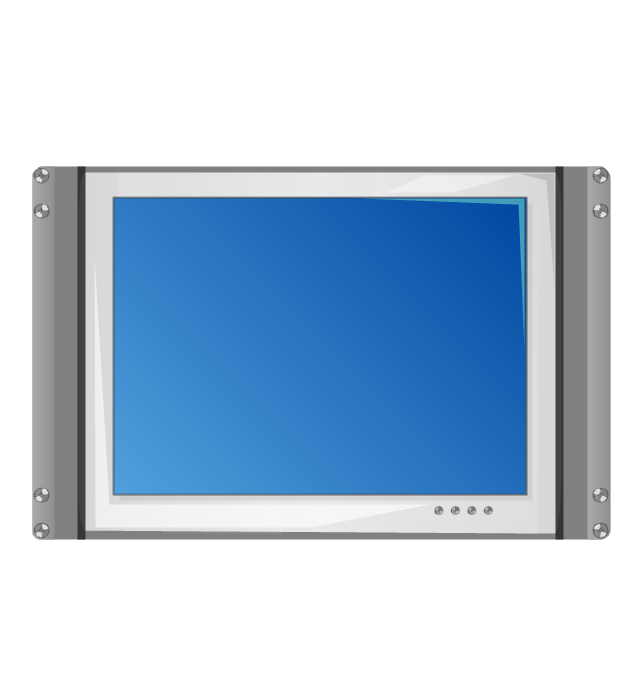
8U rackmount LCD monitor
Fiber optic patch panel (type A)
-rack-diagrams---vector-stencils-library.png--diagram-flowchart-example.png)
Fiber optic patch panel (type B)
-rack-diagrams---vector-stencils-library.png--diagram-flowchart-example.png)
Fiber optic patch panel (type C)
-rack-diagrams---vector-stencils-library.png--diagram-flowchart-example.png)
3U server
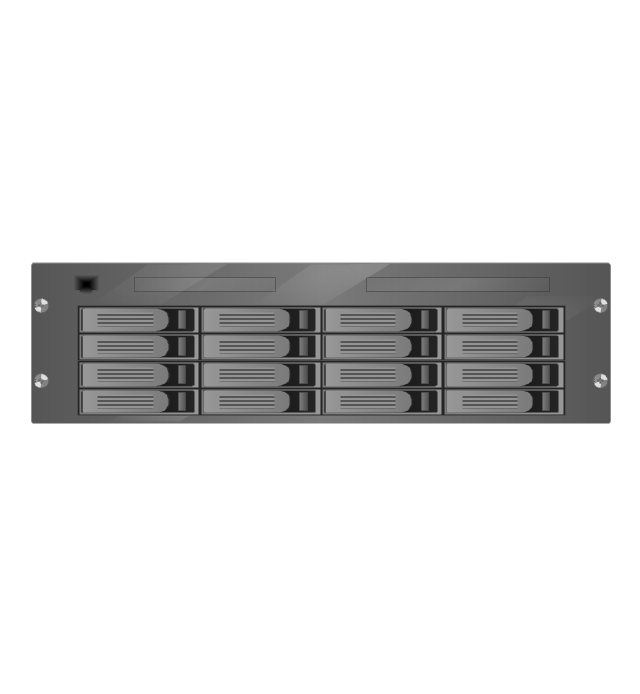
2U RAID array
3U RAID array
Managed UPS
1U 19'' LCD monitor keyboard

1U server
Relationships Analysis

The Seven Management and Planning Tools is a tool for Interaction diagram drawing. This diagram identifies causal relationships. Determine what factors are causes and which factors are effects. Interaction diagram helps establish KPIs to monitor changes and the effectiveness of corrective actions in resolving the problem.

"A home network or home area network (HAN) is a type of local area network that develops from the need to facilitate communication and interoperability among digital devices present inside or within the close vicinity of a home. Devices capable of participating in this network–smart devices such as network printers and handheld mobile computers–often gain enhanced emergent capabilities through their ability to interact. These additional capabilities can then be used to increase the quality of life inside the home in a variety of ways, such as automation of repetitious tasks, increased personal productivity, enhanced home security, and easier access to entertainment." [Home network. Wikipedia]
"A wiring diagram is a simplified conventional pictorial representation of an electrical circuit. It shows the components of the circuit as simplified shapes, and the power and signal connections between the devices.
A wiring diagram usually gives more information about the relative position and arrangement of devices and terminals on the devices, to help in building the device. This is unlike a schematic diagram, where the arrangement of the components' interconnections on the diagram usually does not correspond to the components' physical locations in the finished device. A pictorial diagram would show more detail of the physical appearance, whereas a wiring diagram uses a more symbolic notation to emphasize interconnections over physical appearance.
A wiring diagram is used to troubleshoot problems and to make sure that all the connections have been made and that everything is present." [Wiring diagram. Wikipedia]
The Home area network (HAN) wiring diagram example was created using ConceptDraw PRO diagramming and vector drawing software extended with Computers and Communications solution from Illustration area of ConceptDraw Solution Park.
HAN
This computer security diagram example was designed on the base of the Wikimedia Commons file: Firewall.png.
[commons.wikimedia.org/ wiki/ File:Firewall.png]
This file is licensed under the Creative Commons Attribution-Share Alike 3.0 Unported license. [creativecommons.org/ licenses/ by-sa/ 3.0/ deed.en]
"In computing, a firewall is a network security system that monitors and controls the incoming and outgoing network traffic based on predetermined security rules. A firewall typically establishes a barrier between a trusted, secure internal network and another outside network, such as the Internet, that is assumed to not be secure or trusted. Firewalls are often categorized as either network firewalls or host-based firewalls. Network firewalls are a software appliance running on general purpose hardware or hardware-based firewall computer appliances that filter traffic between two or more networks. Host-based firewalls provide a layer of software on one host that controls network traffic in and out of that single machine. Firewall appliances may also offer other functionality to the internal network they protect such as acting as a DHCP or VPN server for that network." [Firewall (computing). Wikipedia]
The cybersecurity diagram example "Firewall between LAN and WAN" was created using the ConceprDraw PRO software extended with the Network Security Diagrams solution from the Computer and Neworks area of ConceptDraw Solution Park.
Computer security diagram

Server rack diagrams visualize the rack mounting of a computer and network equipment as a frontal view of the rack with the equipment installed. They are used when choosing which equipment or racks to buy, and to see if a particular configuration works, without having to go through a physical install.
"In the hardware sense, the word server typically designates computer models intended for hosting software applications under the heavy demand of a network environment. In this client–server configuration, one or more machines, either a computer or a computer appliance, share information with each other with one acting as a host for the other[s].
While nearly any personal computer is capable of acting as a network server, a dedicated server will contain features making it more suitable for production environments. These features may include a faster CPU, increased high-performance RAM, and increased storage capacity in the form of a larger or multiple hard drives. Servers also typically have reliability, availability and serviceability (RAS) and fault tolerance features, such as redundancy in power supplies, storage (as in RAID), and network connections." [Server (computing). Wikipedia]
This network server rack diagram example was created using the ConceptDraw PRO diagramming and vector drawing software extended with the Rack Diagrams solution from the Computer and Networks area of ConceptDraw Solution Park.
Server rack diagram

TQM Software — Build Professional TQM Diagrams

Process Flow Diagram

ConceptDraw PRO diagramming and vector drawing software extended with powerful tools of Flowcharts Solution from the "What is a Diagram" Area of ConceptDraw Solution Park is effective for drawing: Process Flow Diagram, Flow Process Diagram, Business Process Flow Diagrams.
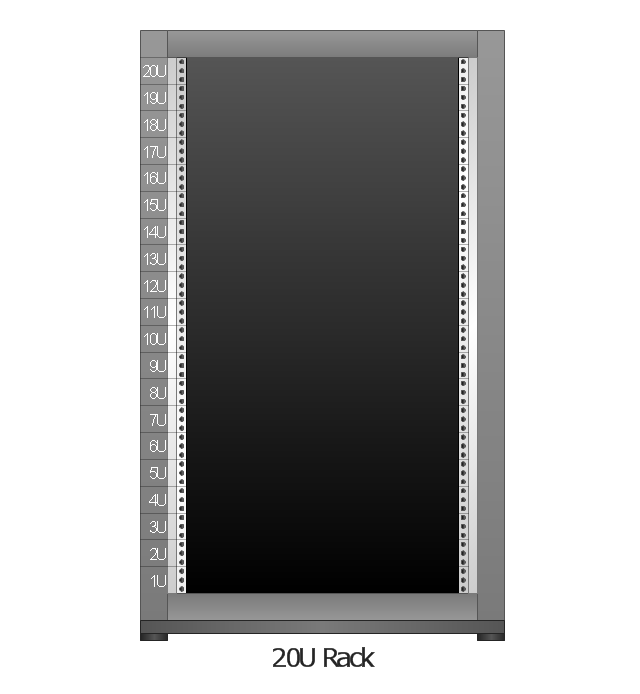
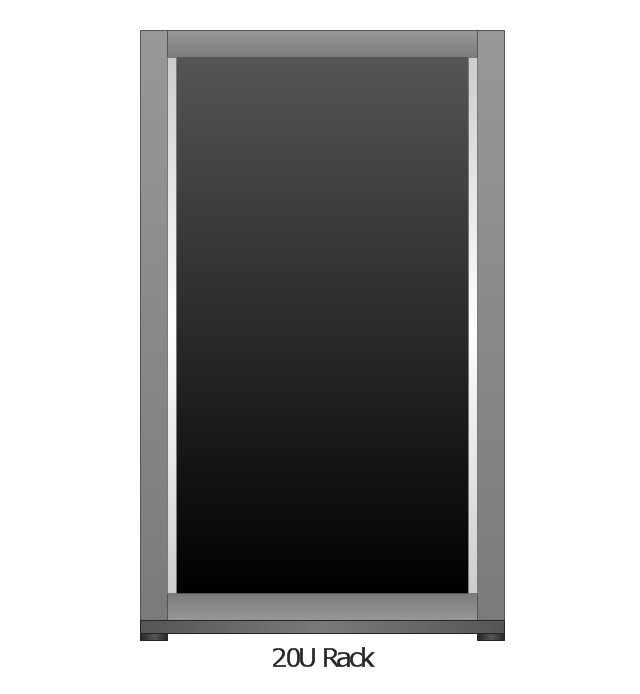
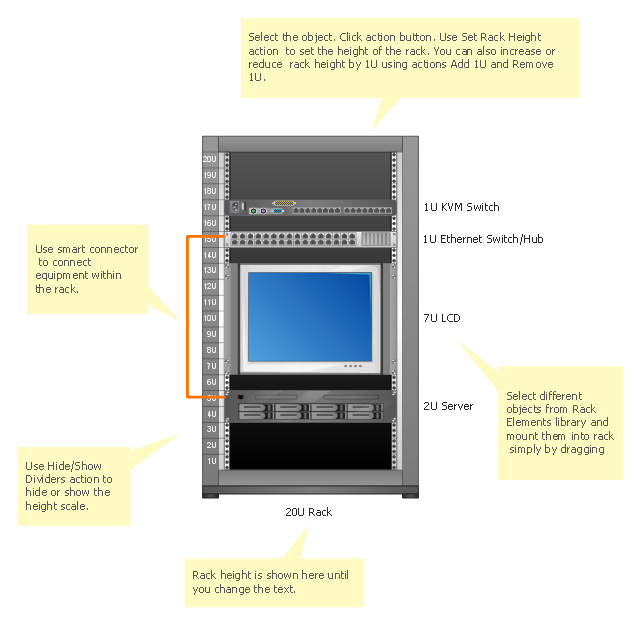
Server rack diagrams visualize the the rack mounting of computer and network equipment as the drawing of frontal view of the rack with equipment installed. They are used for choosing the equipment or racks to buy, and help to organize equipment on the racks virtually, without the real installation.
"A 19-inch rack is a standardized frame or enclosure for mounting multiple equipment modules. Each module has a front panel that is 19 inches (482.6 mm) wide, including edges or ears that protrude on each side which allow the module to be fastened to the rack frame with screws." [19-inch rack. Wikipedia]
"A rack unit, U or RU is a unit of measure that describes the height of equipment designed to mount in a 19-inch rack or a 23-inch rack. The 19-inch (482.6 mm) or 23-inch (584.2 mm) dimension refers to the width of the equipment mounting frame in the rack including the frame; the width of the equipment that can be mounted inside the rack is less. One rack unit is 1.75 inches (4.445 cm) high.
The size of a piece of rack-mounted equipment is frequently described as a number in "U". For example, one rack unit is often referred to as "1U", 2 rack units as "2U" and so on.
A typical full size rack is 42U, which means it holds just over 6 feet of equipment, and a typical "half-height" rack would be 18-22U, or around 3 feet high." [Rack unit. Wikipedia]
The rack diagram template is included in the Rack Diagrams solution from the Computer and Networks area of ConceptDraw Solution Park.
Rack diagram template
TQM Diagram Tool

Fishbone Diagram Problem Solving

To design easily the Fishbone diagram, you can use a special ConceptDraw PRO vector graphic and diagramming software which contains the powerful tools for Fishbone diagram problem solving offered by Fishbone Diagrams solution for the Management area of ConceptDraw Solution Park.
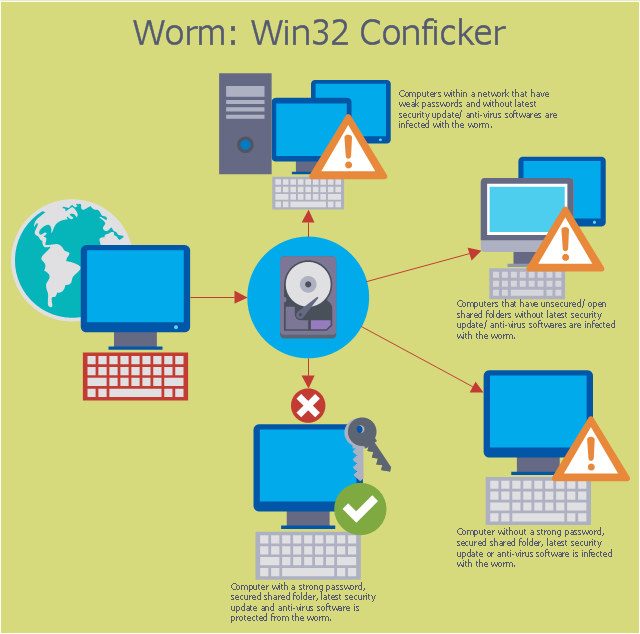
This computer security diagram example was designed on the base of the Wikimedia Commons file: Conficker.svg. [commons.wikimedia.org/ wiki/ File:Conficker.svg]
This file is licensed under the Creative Commons Attribution-Share Alike 3.0 Unported license. [creativecommons.org/ licenses/ by-sa/ 3.0/ deed.en]
"A computer worm is a standalone malware computer program that replicates itself in order to spread to other computers. Often, it uses a computer network to spread itself, relying on security failures on the target computer to access it. Unlike a computer virus, it does not need to attach itself to an existing program. Worms almost always cause at least some harm to the network, even if only by consuming bandwidth, whereas viruses almost always corrupt or modify files on a targeted computer." [Computer worm. Wikipedia]
The cybersecurity diagram example "Spread of Conficker worm" was created using the ConceprDraw PRO software extended with the Network Security Diagrams solution from the Computer and Neworks area of ConceptDraw Solution Park.
Computer security diagram
Pyramid Diagram

- How To Create CCTV Network Diagram
- Computer Monitoring Usecase Diagram
- How to Create a CCTV Diagram in ConceptDraw PRO | Security and ...
- Remote Computer Monitor System Case Tool Activity Diagram
- Rack units | Rack units | Design elements - Rack diagram | Rack Unit
- CCTV Surveillance System Diagram . CCTV Network Diagram ...
- CCTV Surveillance System Diagram . CCTV Network Diagram ...
- Server rack diagram
- How to Create a CCTV Diagram in ConceptDraw PRO | How To ...
- CCTV Network Example | Camera layout schematic | How to Create ...
- How to Create a CCTV Diagram in ConceptDraw PRO | Security and ...
- Security and Access Plans | CCTV Network Diagram Software ...
- SDL process Monitor
- Explain The Project Monitoring Flow Chart
- Diagram Of Firewall Computer
- Remote Computer Monitoring System Class Diagram
- CCTV Network Example | CCTV Surveillance System Diagram ...
- How To Create CCTV Network Diagram | How to Create a CCTV ...
- CCTV Surveillance System Diagram . CCTV Network Diagram ...
- Rack diagram - Template | Rack diagrams - Vector stencils library ...