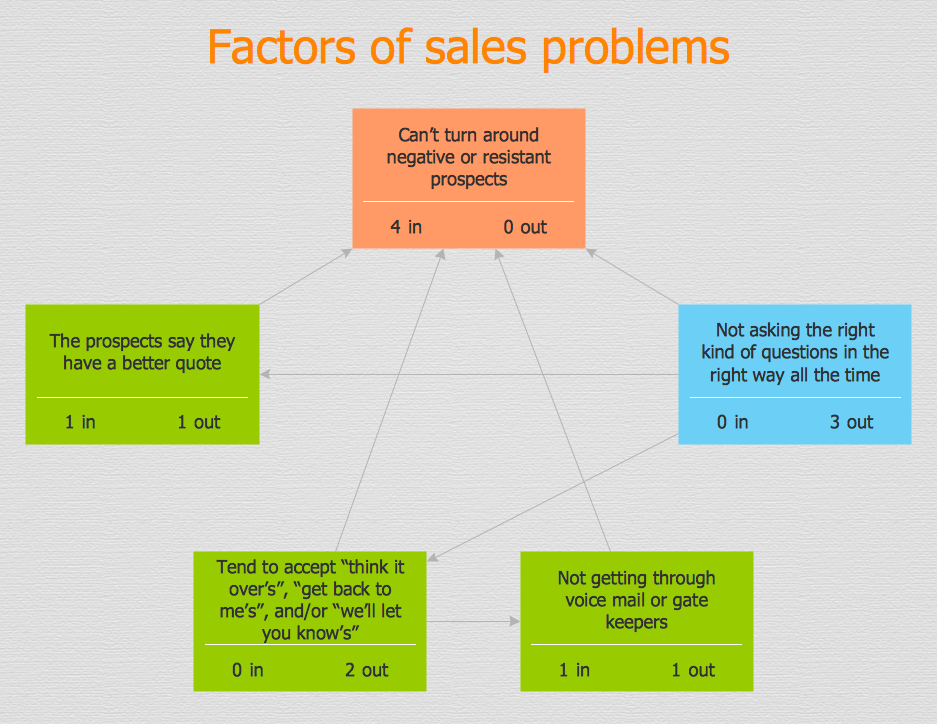
Affinity Diagram
The Affinity Diagram, also known as a KJ diagram, is a business tool invented for organization the large quantity of ideas and data. It is a part of Seven Management and Planning Tools, it is usually used right after brainstorming to sort large numbers of ideas into the corresponding groups. The Affinity Diagram helps to represent in a better way the structure of large and complex factors which influence on a problem, divides these factors into the smaller and simpler structures, and helps team members to see the patterns and identify possible solutions to problems they have. The diagrams of this type don't show the causal relationships between the factors, but they are designed to prepare the data for holding further analysis of the cause-effect relationships. Another area of Affinity Diagram usage is contextual inquiry as a way to sort observations and notes from field interviews, support call logs, open-ended survey responses organizing, etc. ConceptDraw MINDMAP software offers you the tools for easy holding brainstorming, generation ideas and creation MINDMAP Affinity Diagram.
 Quality Mind Map
This solution extends ConceptDraw MINDMAP software with Quality Management Mind Maps (Presentations, Meeting Agendas, Problem to be solved).
Business Productivity - Management
The widespread of Mind Maps in the field of management is justified and very convenient. The managers and leaders work with large amount of information and data, and need the useful tools for its structuring and systemizing. They prefer to use the powerful Mind Mapping software that gives them a lot of benefits. ConceptDraw MINDMAP is professional software for management, business planning, strategic planning, business productivity and development. It provides the powerful tools which help managers to be effective and improve their productivity, supports them in easy visual documenting and communication the management information. Use ConceptDraw MINDMAP to build the Management Diagrams (Matrices, Organizational Charts, Deployment Charts, Timelines, Cause & Effect (Fishbone) Diagrams) and key management Mind Maps (SWOT analysis, problem solving, decision making, business planning, scheduling, thinking ideas, company organizing, preparing and holding the meetings and presentations) quickly and easily.
 Mind Map Exchange
This solution extends ConceptDraw MINDMAP software with the ability to easily exchange mind maps with a large variety of other mind mapping applications.
 Fishbone Diagrams
The Fishbone Diagrams solution extends ConceptDraw DIAGRAM software with the ability to easily draw the Fishbone Diagrams (Ishikawa Diagrams) to clearly see the cause and effect analysis and also problem solving. The vector graphic diagrams produced using this solution can be used in whitepapers, presentations, datasheets, posters, and published technical material.
Root Cause Tree Diagram
The Root Cause Tree Diagram is a chart that helps determine the root causes of factors that influence the problem, to represent and analyze them. This diagram is constructed separately for each high priority factor. First it is needed to identify the root causes for a factor, display their structure and then propose the possible corrective actions. But how to create Root Cause Tree Diagram with the least efforts and time? ConceptDraw MINDMAP will effectively help you in drawing MINDMAP Root Cause Tree Diagram and Root Cause Analysis Tree Diagram used for further formulation of actions. The Root Cause Tree Diagram template, which can be opened at the program from the Input tab, supplies you with a basic mind map structure for your diagram. The central idea describes briefly a problem, the main topics represent the high-level causes of a problem, their subtopics give more details about the different parts of given causes. At the last level of tree are described the potential solutions to each of detailed parts of the causes.PROBLEM ANALYSIS. Relations Diagram
Use the Relations Diagram to create a relations factors map and to identify which factors are “drivers” and “indicators”. This diagram identifies causal relationships and determine what factors are causes or effects. ConceptDraw Office suite is a software for relation diagram making.
 Seven Management and Planning Tools
Seven Management and Planning Tools solution extends ConceptDraw DIAGRAM and ConceptDraw MINDMAP with features, templates, samples and libraries of vector stencils for drawing management mind maps and diagrams.
SWOT Analysis Tool for Small Business
SWOT analysis is effective method of making the plan to evaluate the Strengths, Weaknesses, Opportunities, and Threats involved in a project. SWOT analysis includes the specifying project objectives and attentive identifying the internal and external causes for accomplishing the main project goals. It is actively used in large and small business project management for effective and clear identifying the critical factors. SWOT and TOWS Matrix Diagrams solution is included to ConceptDraw Solution Park and contains the high-quality analysis tools. This graphical solution turns the ConceptDraw DIAGRAM software in an excellent marketing management and advertising agency software, the best SWOT analysis tool for small business or large, as you like and need. Included graphic tools, visual and project planning components make it the best marketing project management software for marketing project planning and for making marketing presentations. Use the ConceptDraw DIAGRAM to create professional and well-designed SWOT matrices in minutes.
 Note Exchange
This solution extends ConceptDraw MINDMAP software with the ability to exchange with Evernote, and access mind maps anywhere, on any computer or mobile device via Evernote.
- Diagram Template Mindmap
- Mind Map Problem Solving And Decision Making Total Quality
- Product Design Problem Mind Map
- Mind Map Problem Analysis Diagram
- Fishbone Risk Analysis
- Strategic Management Map Mind
- Management | Quality Mind Map | Think. Act. Accomplish. | Mind ...
- Cause and Effect Analysis | Fault Tree Diagram | Using Fishbone ...
- Mind Map Tree Diagram
- Positioning map | Competitor Analysis | Service 8 Ps fishbone ...


