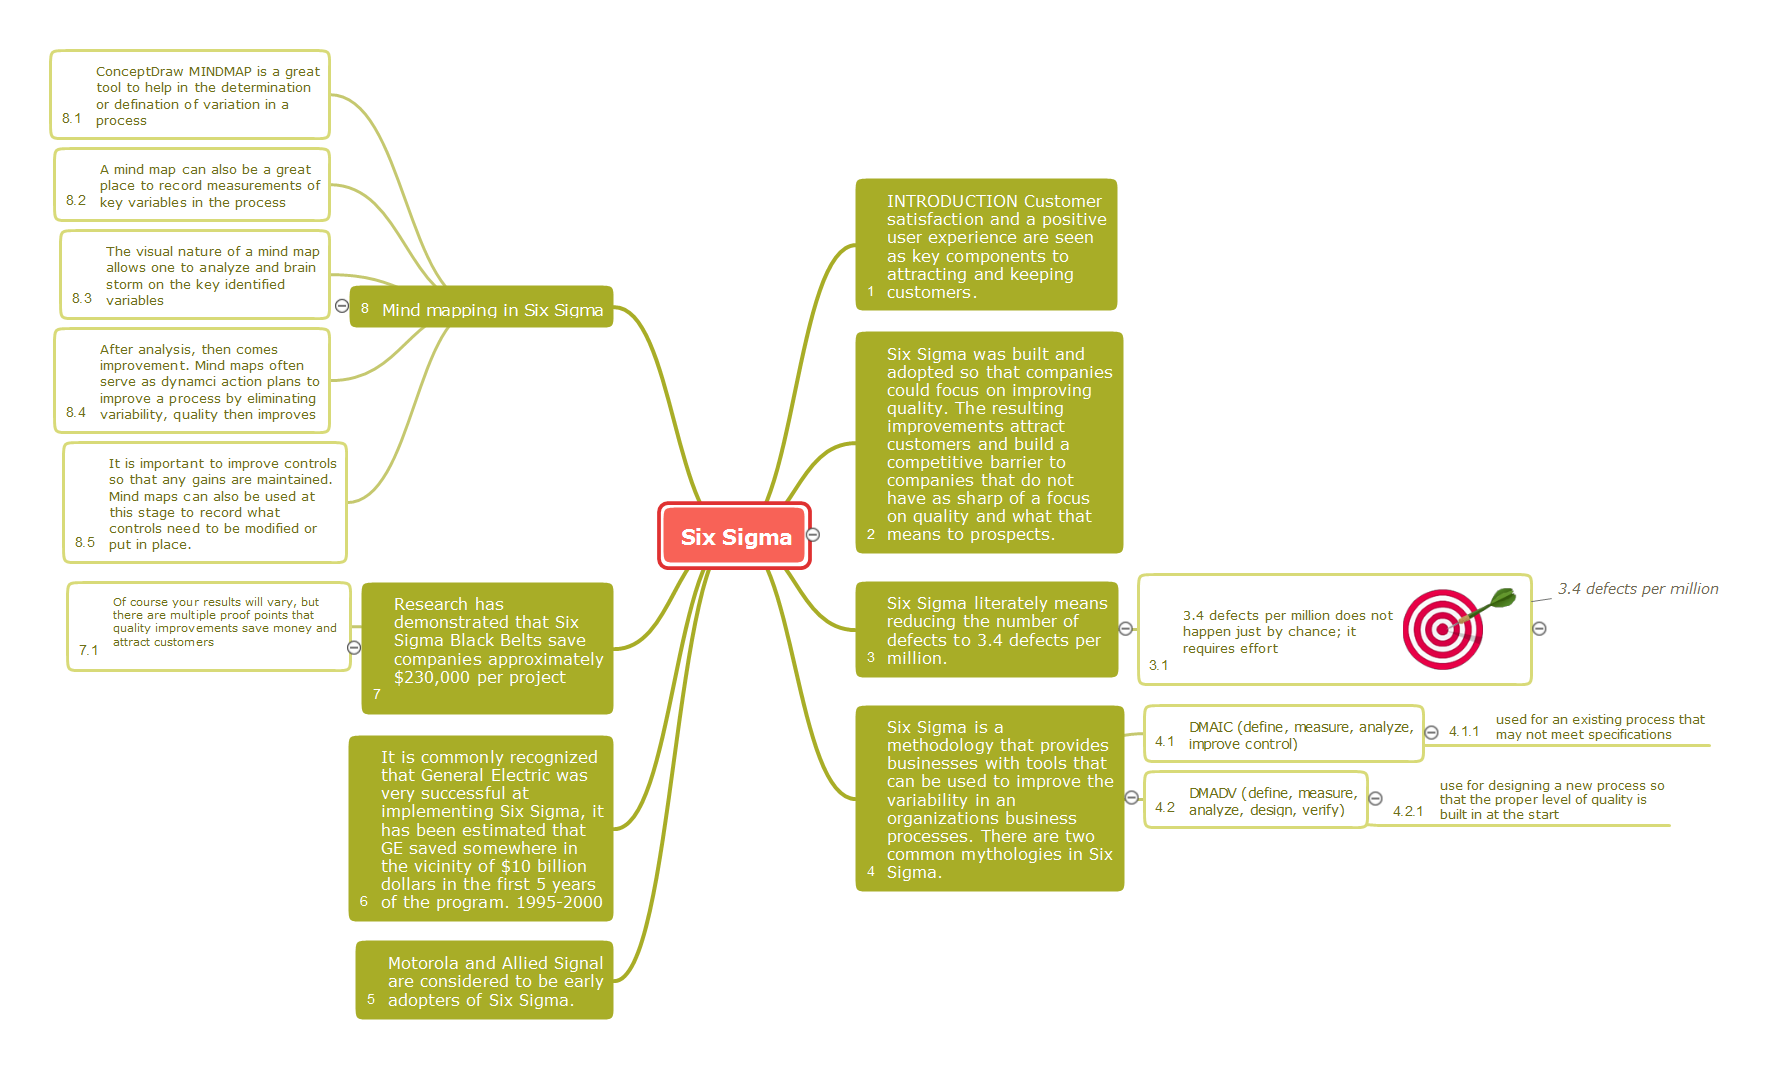
6 Sigma is a popular management concept aimed at improving the quality of work of an organization or individual units and at continuous perfection the processes. The improvement of organization's activities may be executed through the radical changes or in consequence to minor regular improvements. The main purposes of these improvements may be increasing of product safety, improvement quality, decreasing the quantity of defects, shorter the manufacturing cycle, improvement the workplaces, reducing costs, etc. Currently, Six Sigma is applied by organizations of various activity spheres, from the industrial enterprises to the banks. 6 Sigma uses a set of different tools of quality for realizing the improvements and control the processes. Each organization applies its own set of tools, such as Pareto chart, Ishikawa diagram, Tree diagram, etc.
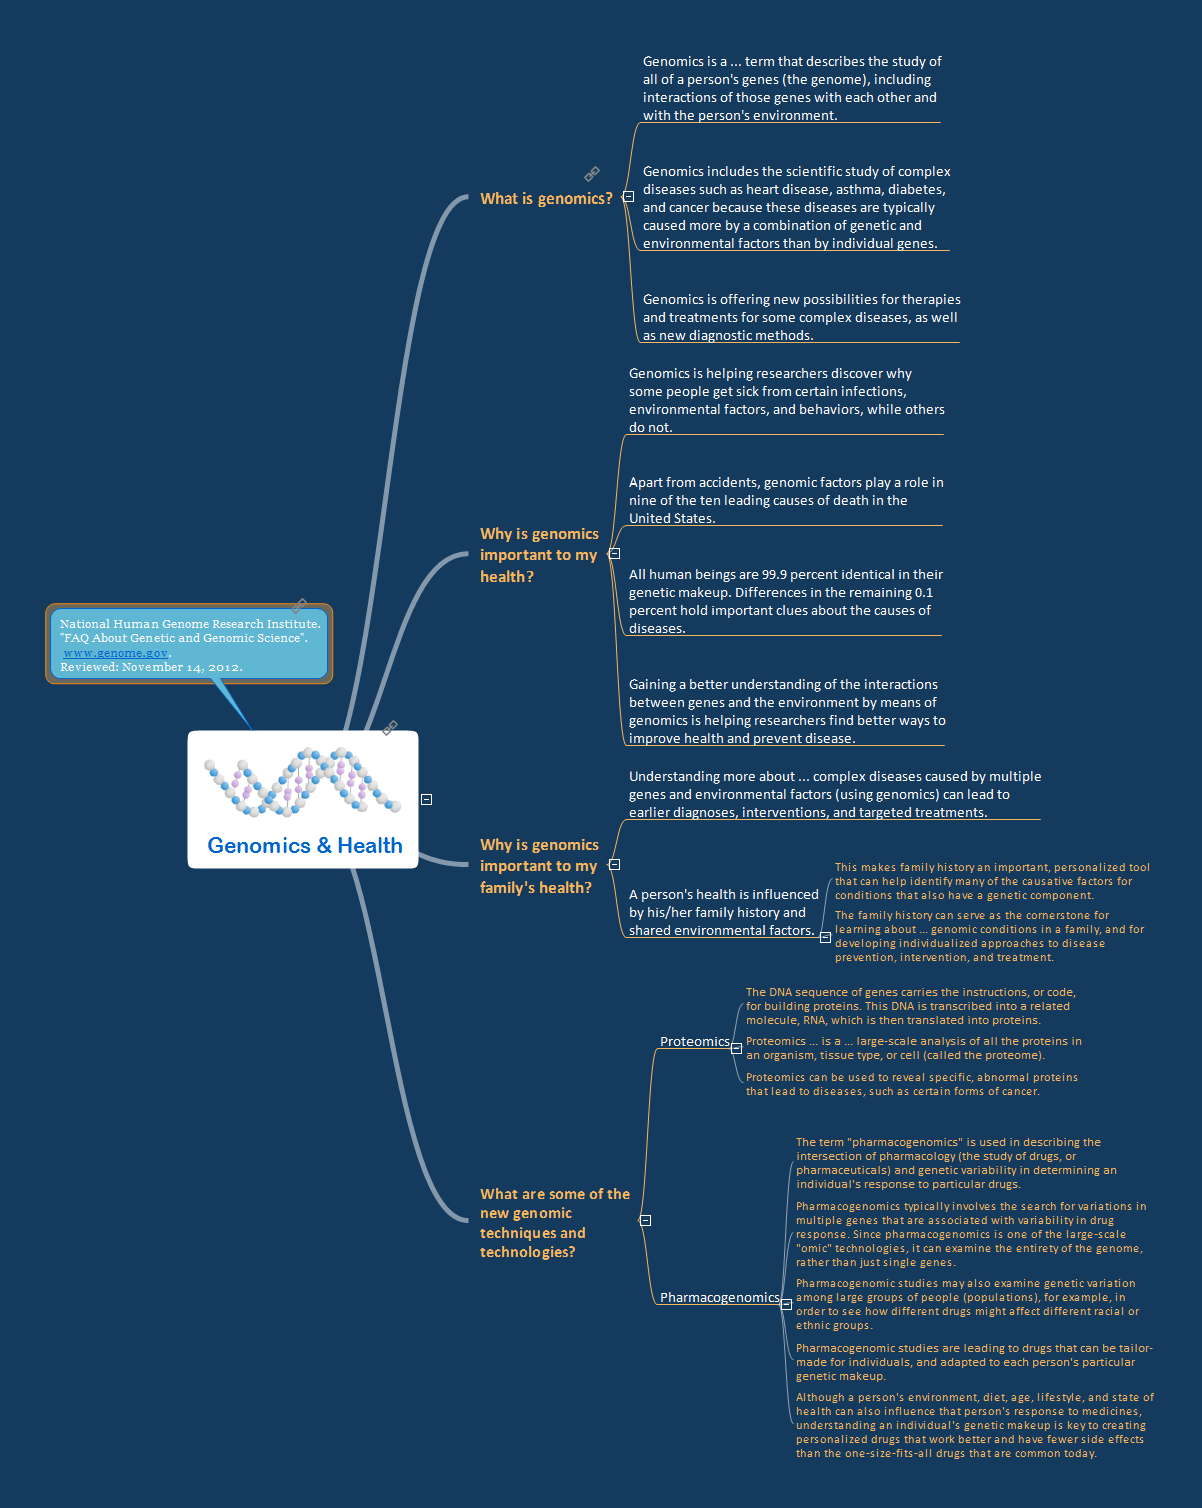
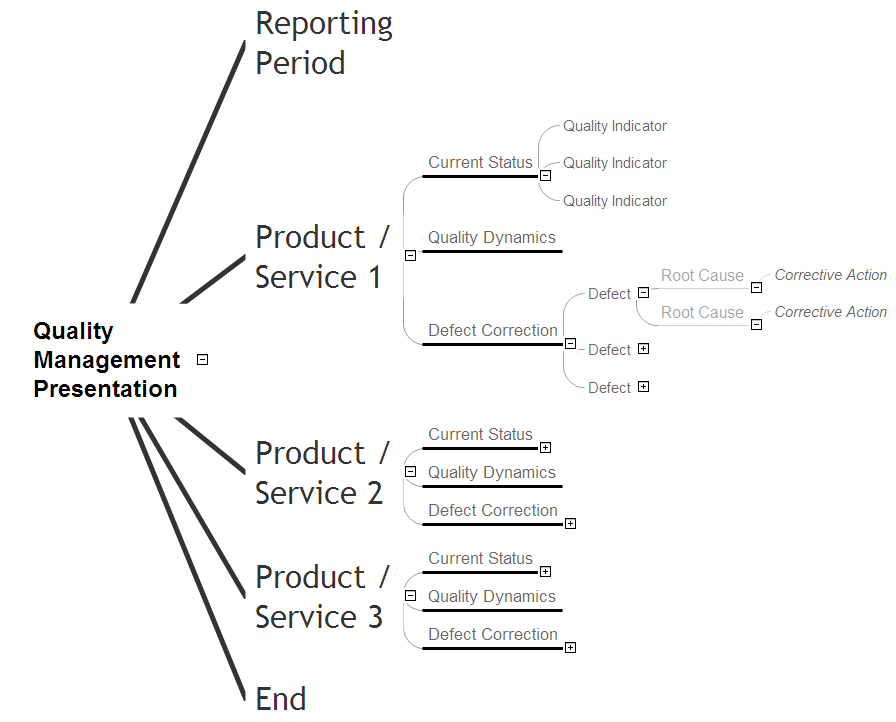
Solutions from the Quality area of ConceptDraw Solution Park support quality and manufacturing managers with powerful visualization tools for production quality control and improvement, and supply the ConceptDraw MINDMAP software with Quality Management Mind Maps. This map illustrates how the Six Sigma methodology can be represented as a Mind Map.