This site uses cookies. By continuing to browse the ConceptDraw site you are agreeing to our Use of Site Cookies.

Improving Problem Solving and Focus with Fishbone Diagrams

When you need to focus on the problem, professional diagramming tool helps you create a Fishbone diagram also known as Ishikawa diagram. Understanding of the problem via Fishbone diagram will improve the processes between departments and teams.
ConceptDraw DIAGRAM extended with Fishbone Diagrams solution gives a powerful tool for improving problem solving and focus with Fishbone diagrams.

Fishbone Diagram

Fishbone Diagram is another name for the Cause and Effect Diagram or the Ishikawa Diagram which got its name from the fact that it looks like a fish skeleton. Developed by Kaoru Ishikawa in 1968, a Fishbone Diagram is effectively used for a cause and effect analysis which allows to consider all possible causes for a certain problem or event.
ConceptDraw DIAGRAM supplied with Fishbone Diagrams solution from the Management area is the best software for fast and easy drawing professional looking Fishbone Diagram.

fishbone diagram, Ishikawa diagram, cause and effect analysis Fishbone Diagrams

fishbone diagram, Ishikawa diagram, cause and effect analysis
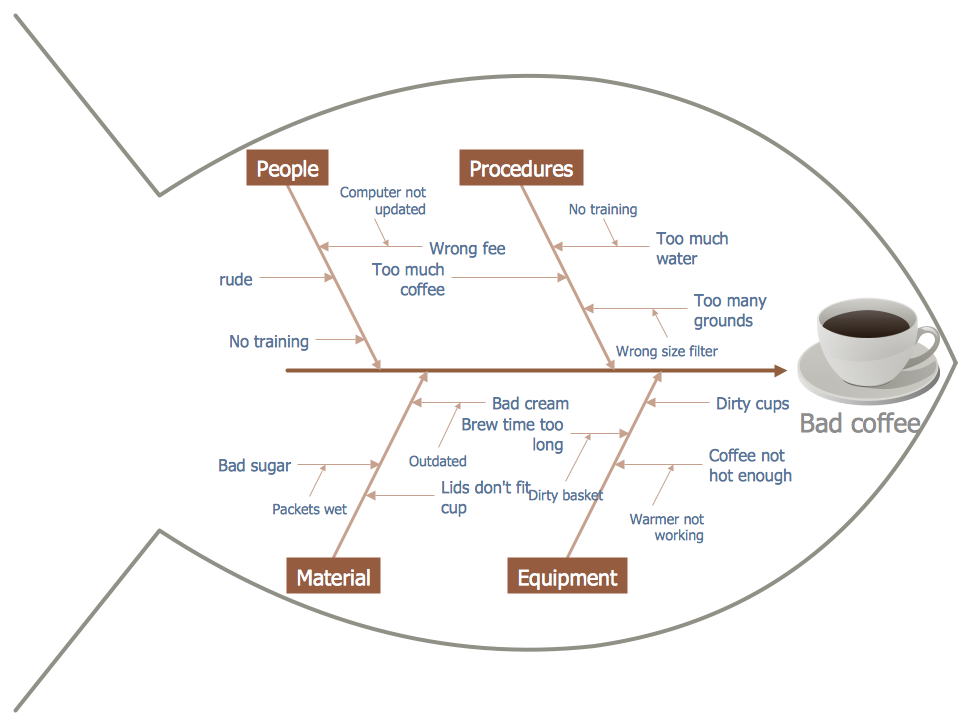
The Fishbone Diagrams solution extends ConceptDraw DIAGRAM software with the ability to easily draw the Fishbone Diagrams (Ishikawa Diagrams) to clearly see the cause and effect analysis and also problem solving. The vector graphic diagrams produced using this solution can be used in whitepapers, presentations, datasheets, posters, and published technical material.

Fishbone Diagram Problem Solving

The Ishikawa diagram, Cause and Effect diagram, Fishbone diagram — all they are the names of one and the same visual method for working with causal connections. Originally invented by Kaoru Ishikawa to control the process quality, the Ishikawa diagram is well proven in other fields of management and personal scheduling, events planning, time management. It is a chart in the form of a fish, whose head is a problem, the fins are variants for its causes.
To design easily the Fishbone diagram, you can use a special ConceptDraw DIAGRAM vector graphic and diagramming software which contains the powerful tools for Fishbone diagram problem solving offered by Fishbone Diagrams solution for the Management area of ConceptDraw Solution Park.

How to Construct a Fishbone Diagram

Fishbone, Ishikawa or Cause and Effect diagram helps understand the reasons of completed or potential actions by structuring their causes in smaller categories. Also, one can use it to see how the contributing factors are related to each other. In everyday company routine, a Cause and Effect diagram is helpful with a number of regular activities like brainstorming, project management, and problem solving.
How to Construct a Fishbone Diagram? Construction a Fishbone diagram in professional diagramming software ConceptDraw DIAGRAM is more easy than you think. Just use the predesigned vector elements from the Fishbone Diagrams library for Fishbone Diagrams solution or one of plenty Fishbone templates and examples, and you will get a Cause and Effect diagram in minutes.

Venn Diagram Examples for Problem Solving. Environmental Social Science. Human Sustainability Confluence

The Venn diagram example below shows sustainable development at the confluence of three constituent parts.
Create your Venn diagrams for problem solving in environmental social science using the ConceptDraw DIAGRAM diagramming and vector drawing software extended with the Venn Diagrams solution from the area "Diagrams" of ConceptDraw Solution Park.

Draw Diagram on Mac

Professional diagramming software for mac helps you create Cause and Effect diagram known as Fishbone diagram or Ishikawa diagram from ConceptDraw Business Solution.

You will be offered to use templates, samples or draw your diagram using ConceptDraw Arrows10 Technology

network topology diagram software, network icons, network diagram template, networking icons available, how to draw a network diagram Computer Network Diagrams

network topology diagram software, network icons, network diagram template, networking icons available, how to draw a network diagram
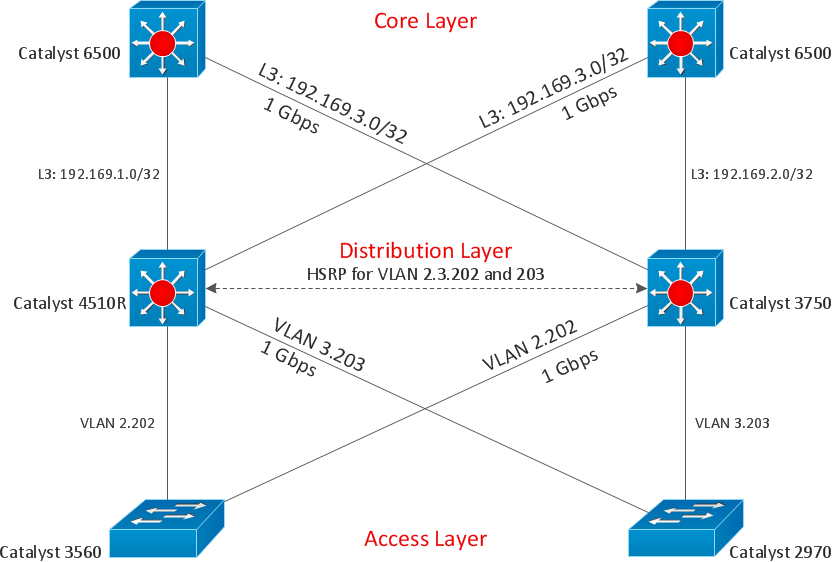
Computer Network Diagrams solution extends ConceptDraw DIAGRAM software with samples, templates and libraries of vector icons and objects of computer network devices and network components to help you create professional-looking Computer Network Diagrams, to plan simple home networks and complex computer network configurations for large buildings, to represent their schemes in a comprehensible graphical view, to document computer networks configurations, to depict the interactions between network's components, the used protocols and topologies, to represent physical and logical network structures, to compare visually different topologies and to depict their combinations, to represent in details the network structure with help of schemes, to study and analyze the network configurations, to communicate effectively to engineers, stakeholders and end-users, to track network working and troubleshoot, if necessary.

Diagrams Mean Nothing

You are probably familiar with diagrams. But have you ever thought that they are useless? This article will explain you why.

ConceptDraw DIAGRAM ER Diagram Tool

ER-diagram is a tool used for database modeling which allows to determine data and relationships among the data. These diagrams help to detail data storages and to document all the properties of designed system. ER-diagram contains entities, attributes of the entities and the relationships between them. Chen’s notation and Crow’s foot notation are commonly used to represent elements in ER-model. To create such diagram you should use specific software, such as Entity-Relationship Diagram solution for ConceptDraw DIAGRAM.
ConceptDraw ER Diagram Tool works across any platform, meaning you never have to worry about compatibility again. ConceptDraw DIAGRAM allows you to make Entity-Relationship Diagram (ERD) on PC or macOS operating systems.