This site uses cookies. By continuing to browse the ConceptDraw site you are agreeing to our Use of Site Cookies.

Organizational Chart

Use the advantages of hierarchical tree structure of mind map while developing the organizational structure of your organization. Create an Organizational Chart from your map. Double click the icon to create an Organizational Chart.

The diagram is created automatically from the active page of your map by ConceptDraw DIAGRAM and will be opened in Slideshow mode.

Quality Improvement

Constant improvement of key performance indicators that are related to quality is a step in the right direction for a company interested in market growth.

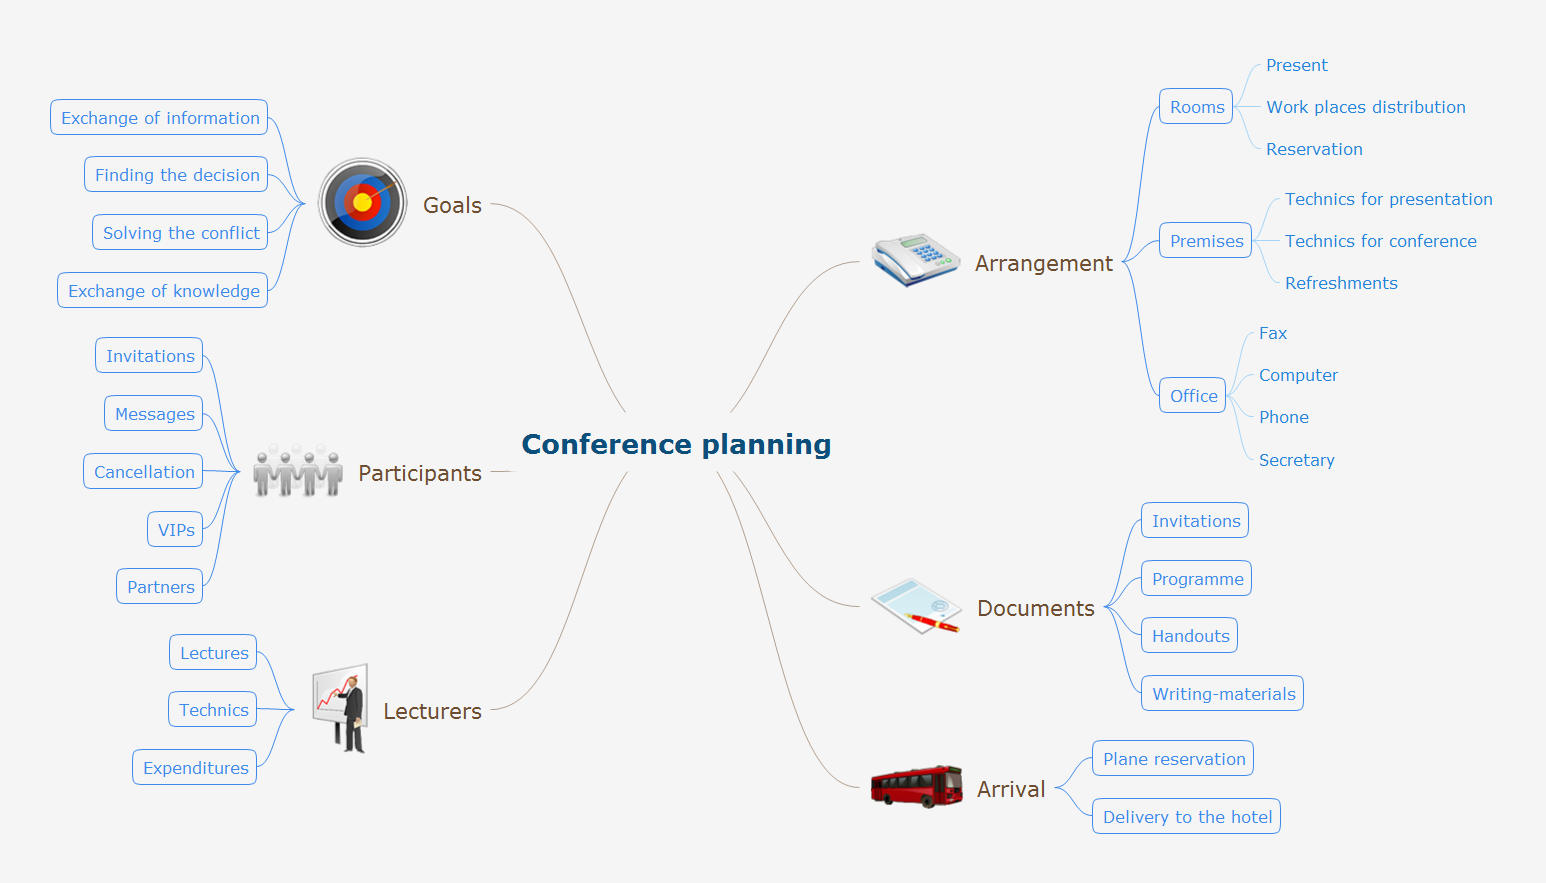
Quality Mind Maps - samples and templates
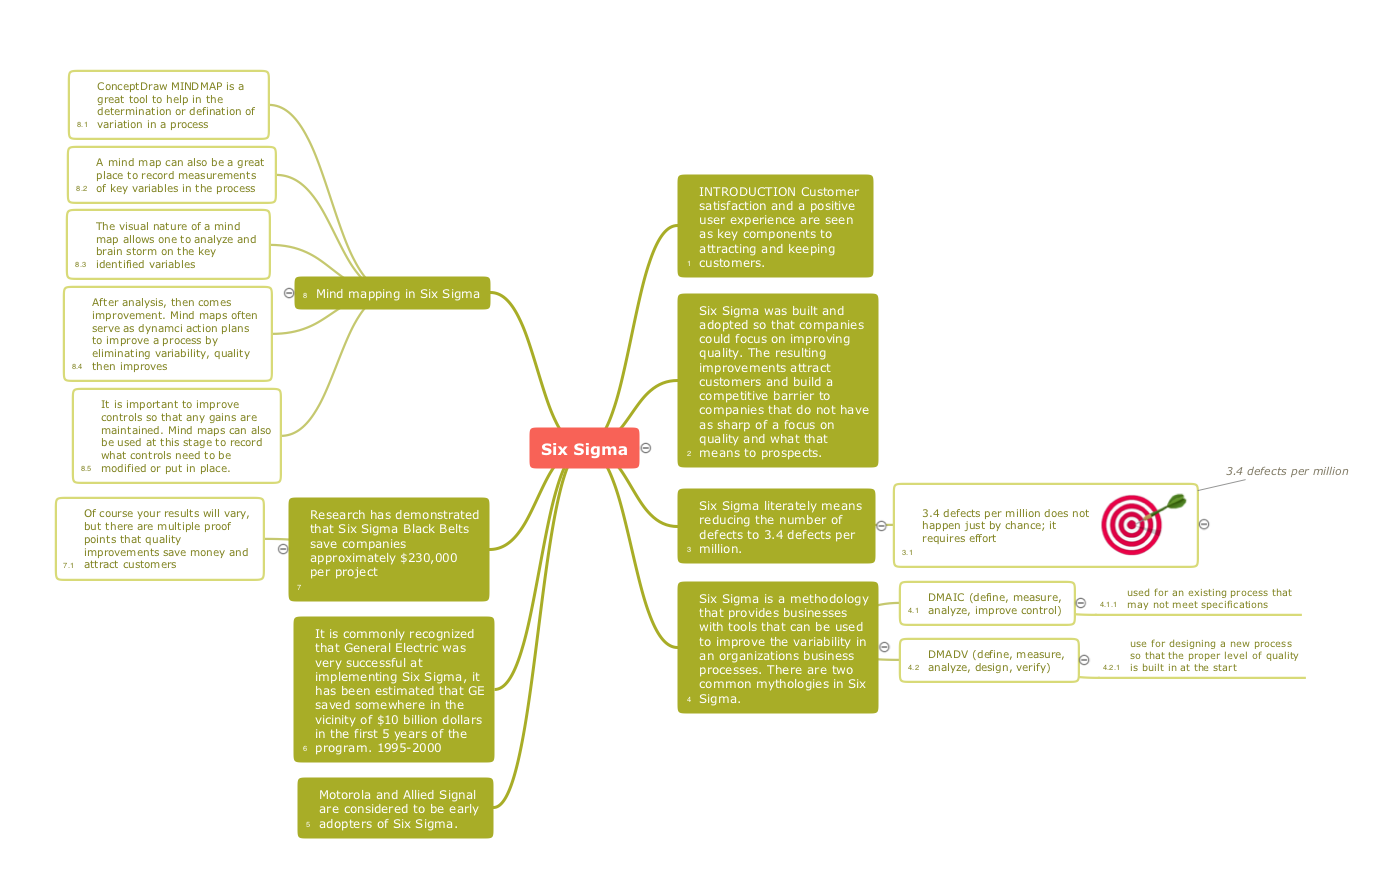
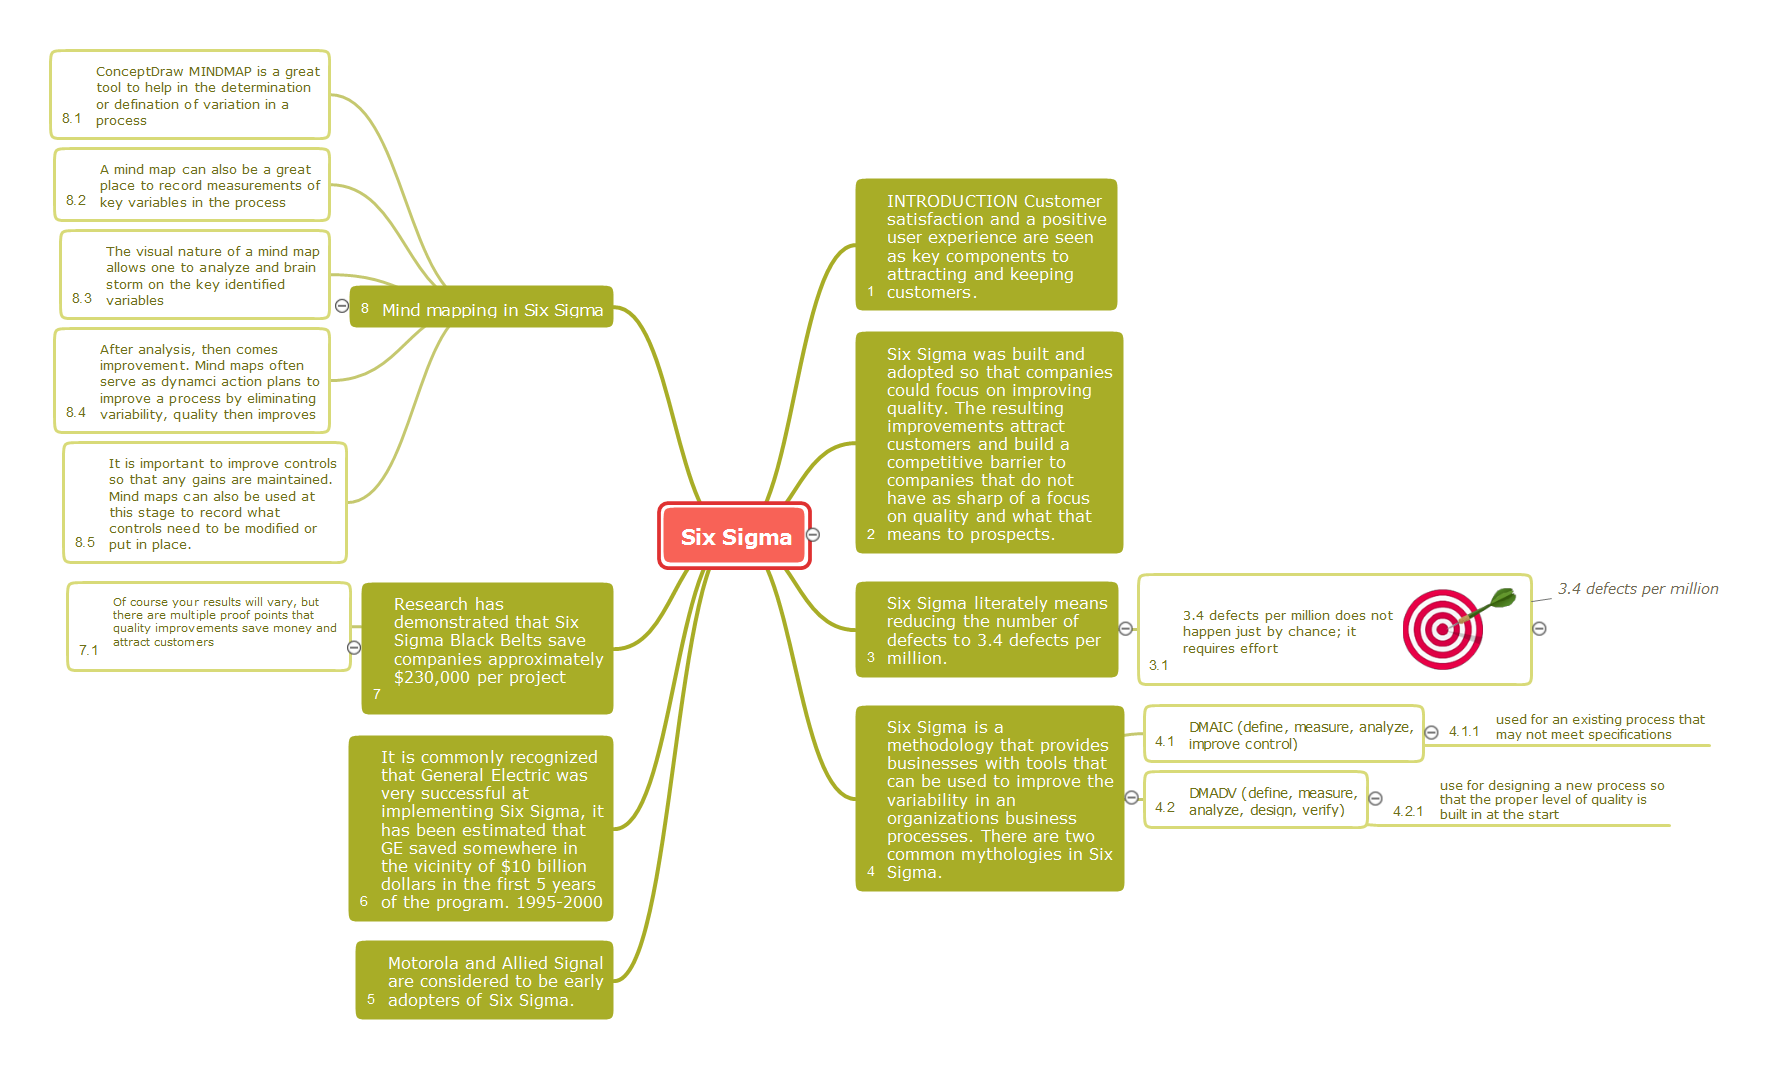
Use samples and templates to describe your own quality processes, brainstorm, and structure quality issues.

6 sigma

This mind map shows how Six Sigma methodology be represented as a mind map. Six Sigma is a quality management methodology allows reducing the number of defects to 3.4 defects per million.

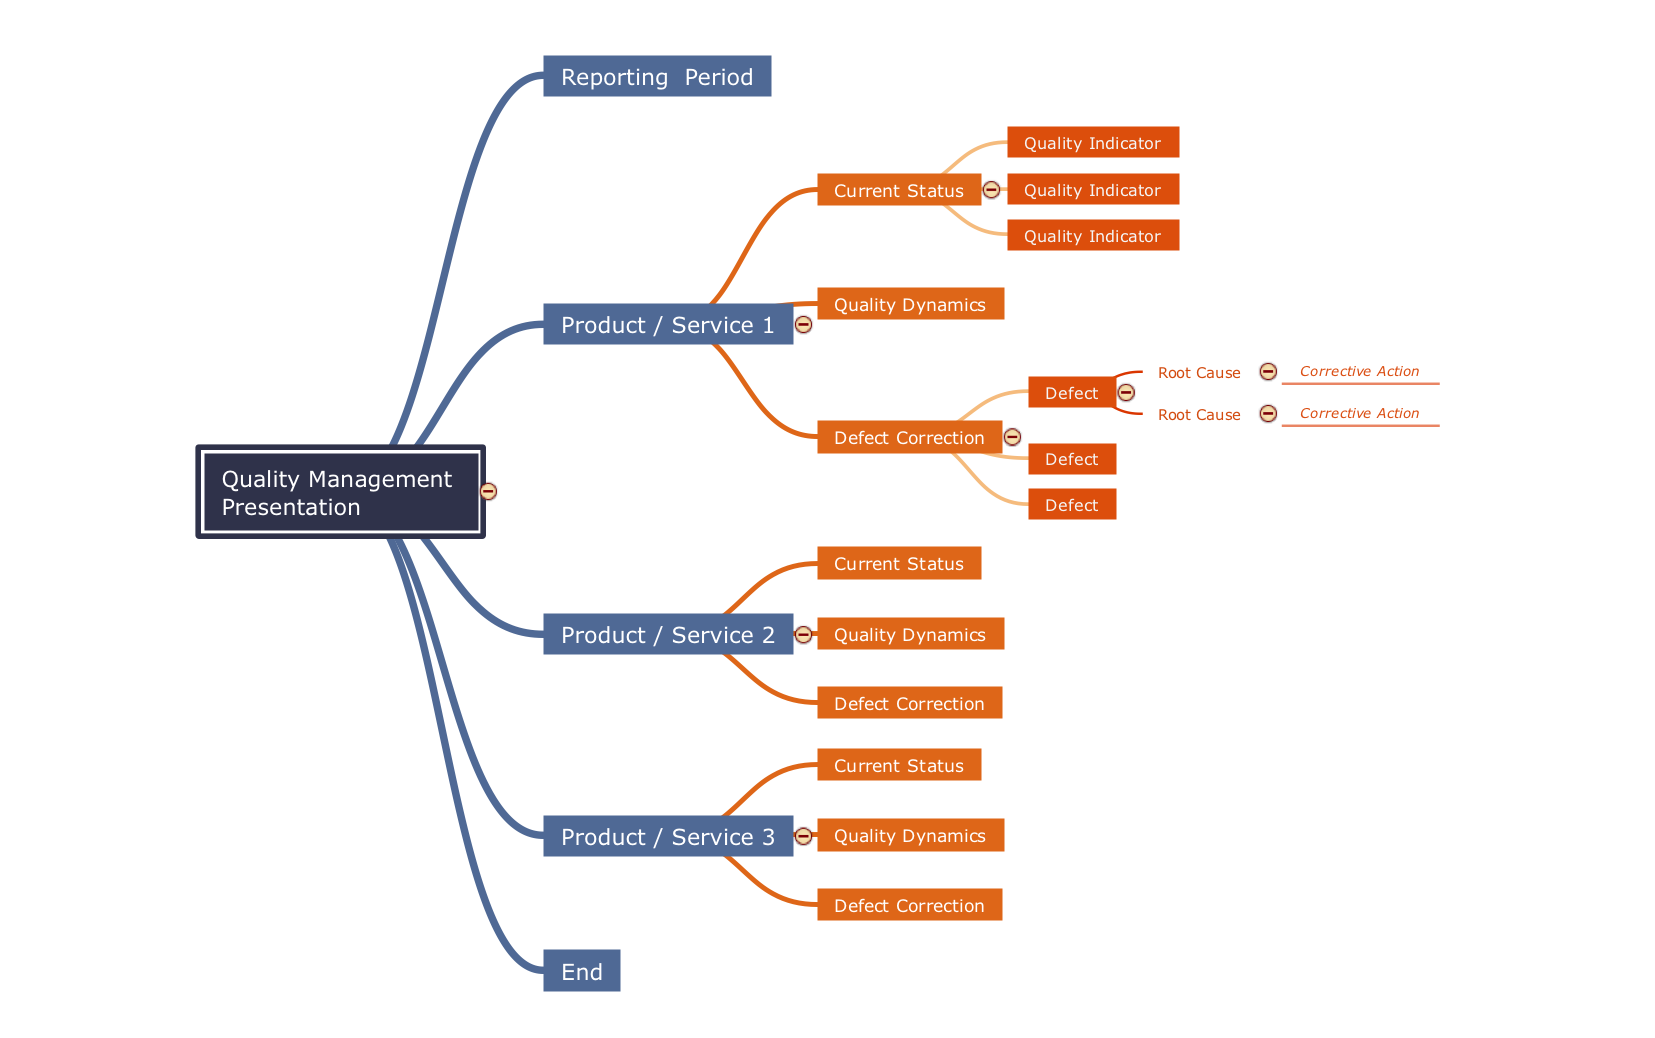
What is a Quality Management

Successful quality management implemented in a company of any size is a critical component of a company organization.

quality management mind map, quality management mindmap Quality Mind Map

quality management mind map, quality management mindmap
This solution extends ConceptDraw MINDMAP software with Quality Management Mind Maps (Presentations, Meeting Agendas, Problem to be solved).

Program for Making Presentations

ConceptDraw MINDMAP the will guide you in creating and demonstrating powerful mind map presentations.

Mind Map - Quality Structure

ConceptDraw MINDMAP is a good way to describe visual instructions on any quality process.

Business Processes

The most worked out and commonly used methodology of business processes description is IDEF methodology. Besides business processes it allows to describe functional blocks, for example production and marketing. ConceptDraw lets creation of business processes description using IDEF0 and IDEF2 methods.

How to Create Flowcharts for an Accounting Information System

Accounting information is a system of processes to represent financial and accounting data that is used by decision makers. To represent accounting processes there are special symbols which are used to create accounting flowcharts.
Flowcharts help users of Accounting Information System to understand the step sequences of accounting processes. Use ConceptDraw DIAGRAM with Accounting Flowcharts solution to document and communicate visually how accounting processes work, and how each operation is done.