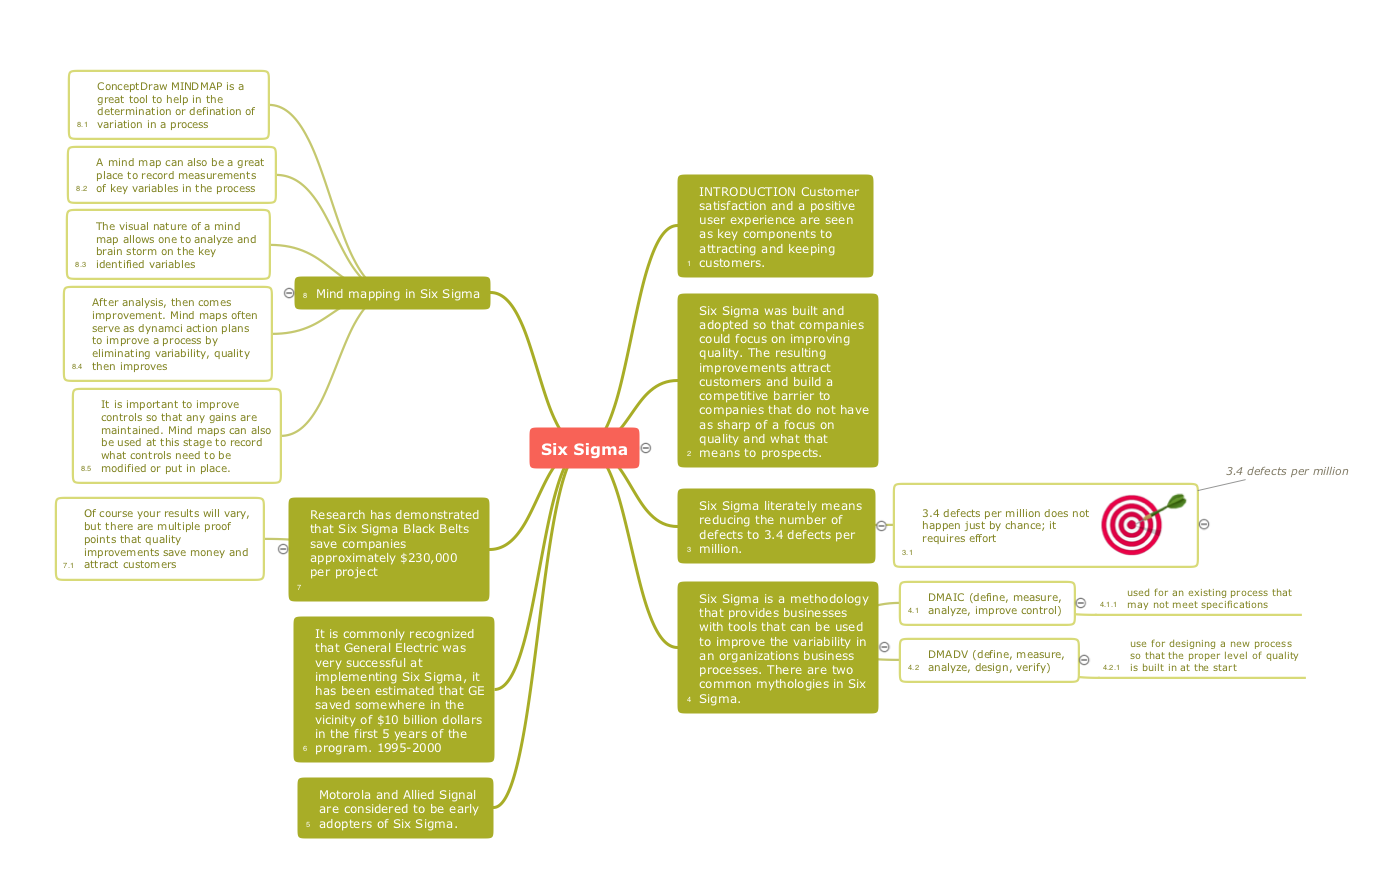
This site uses cookies. By continuing to browse the ConceptDraw site you are agreeing to our Use of Site Cookies.

quality management mind map, quality management mindmap Quality Mind Map

quality management mind map, quality management mindmap
This solution extends ConceptDraw MINDMAP software with Quality Management Mind Maps (Presentations, Meeting Agendas, Problem to be solved).

Concept Map

A concept map is a way of representing relationships between ideas, images, or words.
How to draw a Concept Map quick, easy and effective? ConceptDraw DIAGRAM offers the unique Concept Maps Solution from the "Diagrams" Area that will help you!
HelpDesk

How to Create a Fishbone (Ishikawa) Diagram Quickly

A Fishbone (Ishikawa) diagram is also called a cause-and-effect diagram. Fishbone diagram is often used in business to determine the cause of some problem. The diagram illustrates the main causes and sub-causes leading to an event. The main goal of the Fishbone diagram is to illustrate in a graphical way the relationship between a given outcome and all the factors that influence this outcome. The complete diagram resembles a fish skeleton as its name implies. The ability to create a Fishbone Diagram is supported by the Fishbone Diagram solution. Use ConceptDraw MINDMAP for structuring data and then ConceptDraw DIAGRAM for generating a Fishbone Diagram from mind map structure.

Quality Mind Maps - samples and templates

Use samples and templates to describe your own quality processes, brainstorm, and structure quality issues.

Mind Maps for Business - SWOT Analysis

ConceptDraw SWOT analysis software is a strategic planning method used to evaluate the Strengths, Weaknesses, Opportunities, and Threats facing a project or business.
HelpDesk

How To Create a Concept Map in Visio

ConceptDraw DIAGRAM allows you to easily create concept maps and then make an MS Visio file from your diagrams in a few simple steps.

Affinity Diagram

The Affinity Diagram shows the structure of large, complex factors that have an influence on a problem, and then divides them up into a smaller and simpler structure. The Affinity Diagram does not show a causal relationship between the factors. This diagram is designed to prepare the data for further analysis of the cause-effect relationships.

Bubble diagrams with ConceptDraw DIAGRAM

Using ConceptDraw you will be able to create bubble diagrams from the ready ConceptDraw library objects or make your own objects. The created diagram can be saved and edited, objects can be moved and links between them will be automatically repainted after object moving because of using the ConceptDraw connectors.

file exchange, mind map, mindmap, mindmapping, project, skype presentation, import, export, data exchange, file exchange, open file, XMind, FreeMind, OPML, Mindjet, Mindmanager, Mindjet Mindmanager, mindjet mindmanager pro 7, mindjet mindmanager 2012 Mind Map Exchange

file exchange, mind map, mindmap, mindmapping, project, skype presentation, import, export, data exchange, file exchange, open file, XMind, FreeMind, OPML, Mindjet, Mindmanager, Mindjet Mindmanager, mindjet mindmanager pro 7, mindjet mindmanager 2012
This solution extends ConceptDraw MINDMAP software with the ability to easily exchange mind maps with a large variety of other mind mapping applications.