 Block Diagrams
Block diagrams solution extends ConceptDraw PRO software with templates, samples and libraries of vector stencils for drawing the block diagrams.
Basic Flowchart Symbols and Meaning


Total Quality Management Definition

Create Block Diagram

 ConceptDraw Solution Park
ConceptDraw Solution Park collects graphic extensions, examples and learning materials
Venn Diagram Examples for Problem Solving. Environmental Social Science. Human Sustainability Confluence

Venn Diagram Examples for Problem Solving. Computer Science. Chomsky Hierarchy

 Biology
Biology solution extends ConceptDraw PRO software with samples, templates and libraries containing biological vector symbols, to help you create scientific and educational designs in the field of biology.
Cross-Functional Flowchart Basics


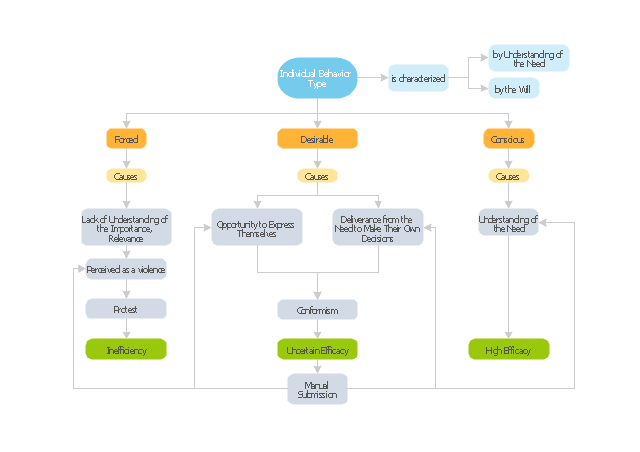
"Organizational behavior is a field of study that investigates the impact that individuals, groups and structures have on behavior within an organization for the purpose of applying such knowledge towards improving an organization's effectiveness. It is an interdisciplinary field that includes sociology, psychology, communication, and management; and it complements the academic studies of organizational theory (which is focused on organizational and intra-organizational topics) and human resource studies (which is more applied and business-oriented). It may also be referred to as organizational studies or organizational science." [Organizational behavior. Wikipedia]
The block diagram example "Types of individual behavior in organization" was created using the ConceptDraw PRO diagramming and vector drawing software extended with the Block Diagrams solution from the area "What is a Diagram" of ConceptDraw Solution Park.
The block diagram example "Types of individual behavior in organization" was created using the ConceptDraw PRO diagramming and vector drawing software extended with the Block Diagrams solution from the area "What is a Diagram" of ConceptDraw Solution Park.
Block diagram
 Total Quality Management TQM Diagrams
Total Quality Management Diagrams solution extends ConceptDraw PRO software with samples, templates and vector stencils library for drawing the TQM flowcharts.
 Venn Diagrams
Venn Diagrams are actively used to illustrate simple set relationships in set theory and probability theory, logic and statistics, mathematics and computer science, linguistics, sociology, and marketing. Venn Diagrams are also often used to visually summarize the status and future viability of a project.
- Simple Block Diagram Of Scientific Management
- Management Science In Decision Makeing With Block Daigram
- Block Diagram Of Function Organization Management
- Block Diagrams | Basic Flowchart Symbols and Meaning ...
- Scientific Management Block Diagram
- Plant Layout Plans | Block Diagrams | Cross-Functional Flowchart ...
- Daigram Of Scientific Management
- Block diagram - Total solution process | Process Flowchart ...
- Daigrams Of Scientific Management
- Decision Making | Block diagram - Customer decision making ...
- Basic Diagramming | Block diagram - Types of individual behavior in ...
- Flow Diagram For Scientific Management
- Scientific Management Flow Chart
- Diagrams Of Scientific Management
- Block Diagrams | Venn Diagram Examples for Problem Solving ...
- Block diagram - Total solution process | Total Quality Management ...
- Block diagram - Types of individual behavior in organization | Block ...
- Block Diagram For Financial Management System
- Block Diagrams | Process Flowchart | Venn Diagram Examples for ...
- Management Of Organisations Of Block Diagram