Sign Making Software
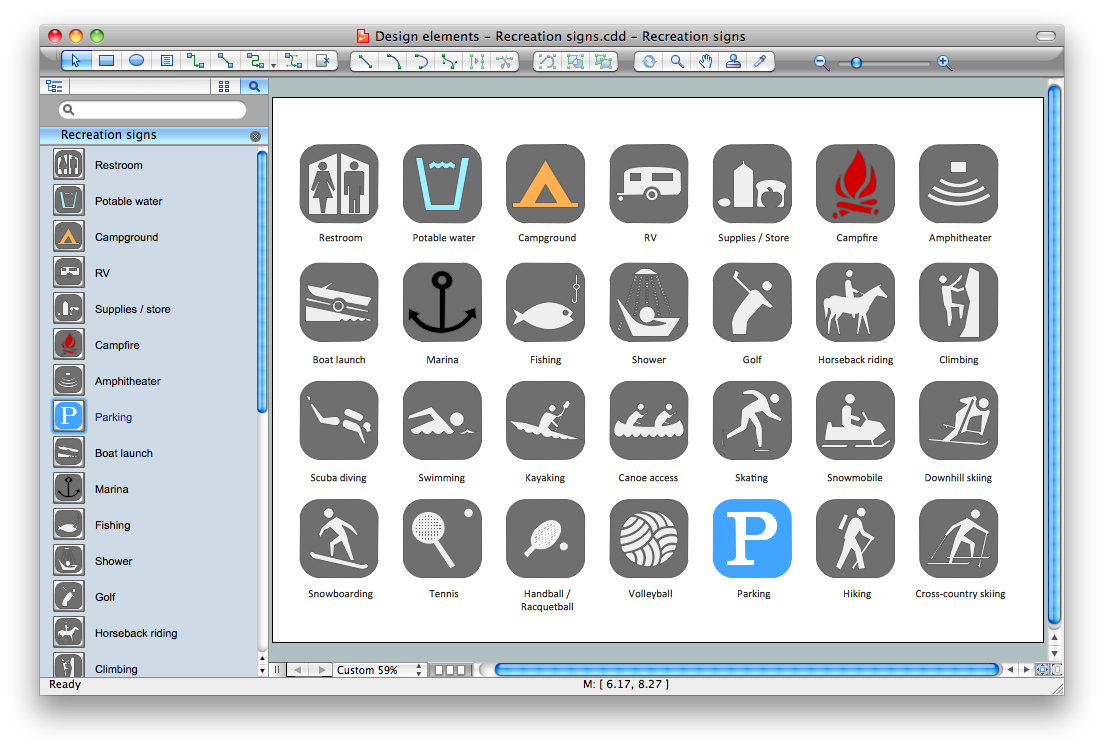
ConceptDraw PRO is a powerful sign making software thanks to the vector stencils library "Recreation signs". This library is included in the Directional Maps solution from the Maps area of ConceptDraw Solution Park. Sign making software is very useful tool for professional sign-making business. Use ConceptDraw PRO and make sure that now sign making is easier and timesaving than ever!Fire Exit Plan. Building Plan Examples
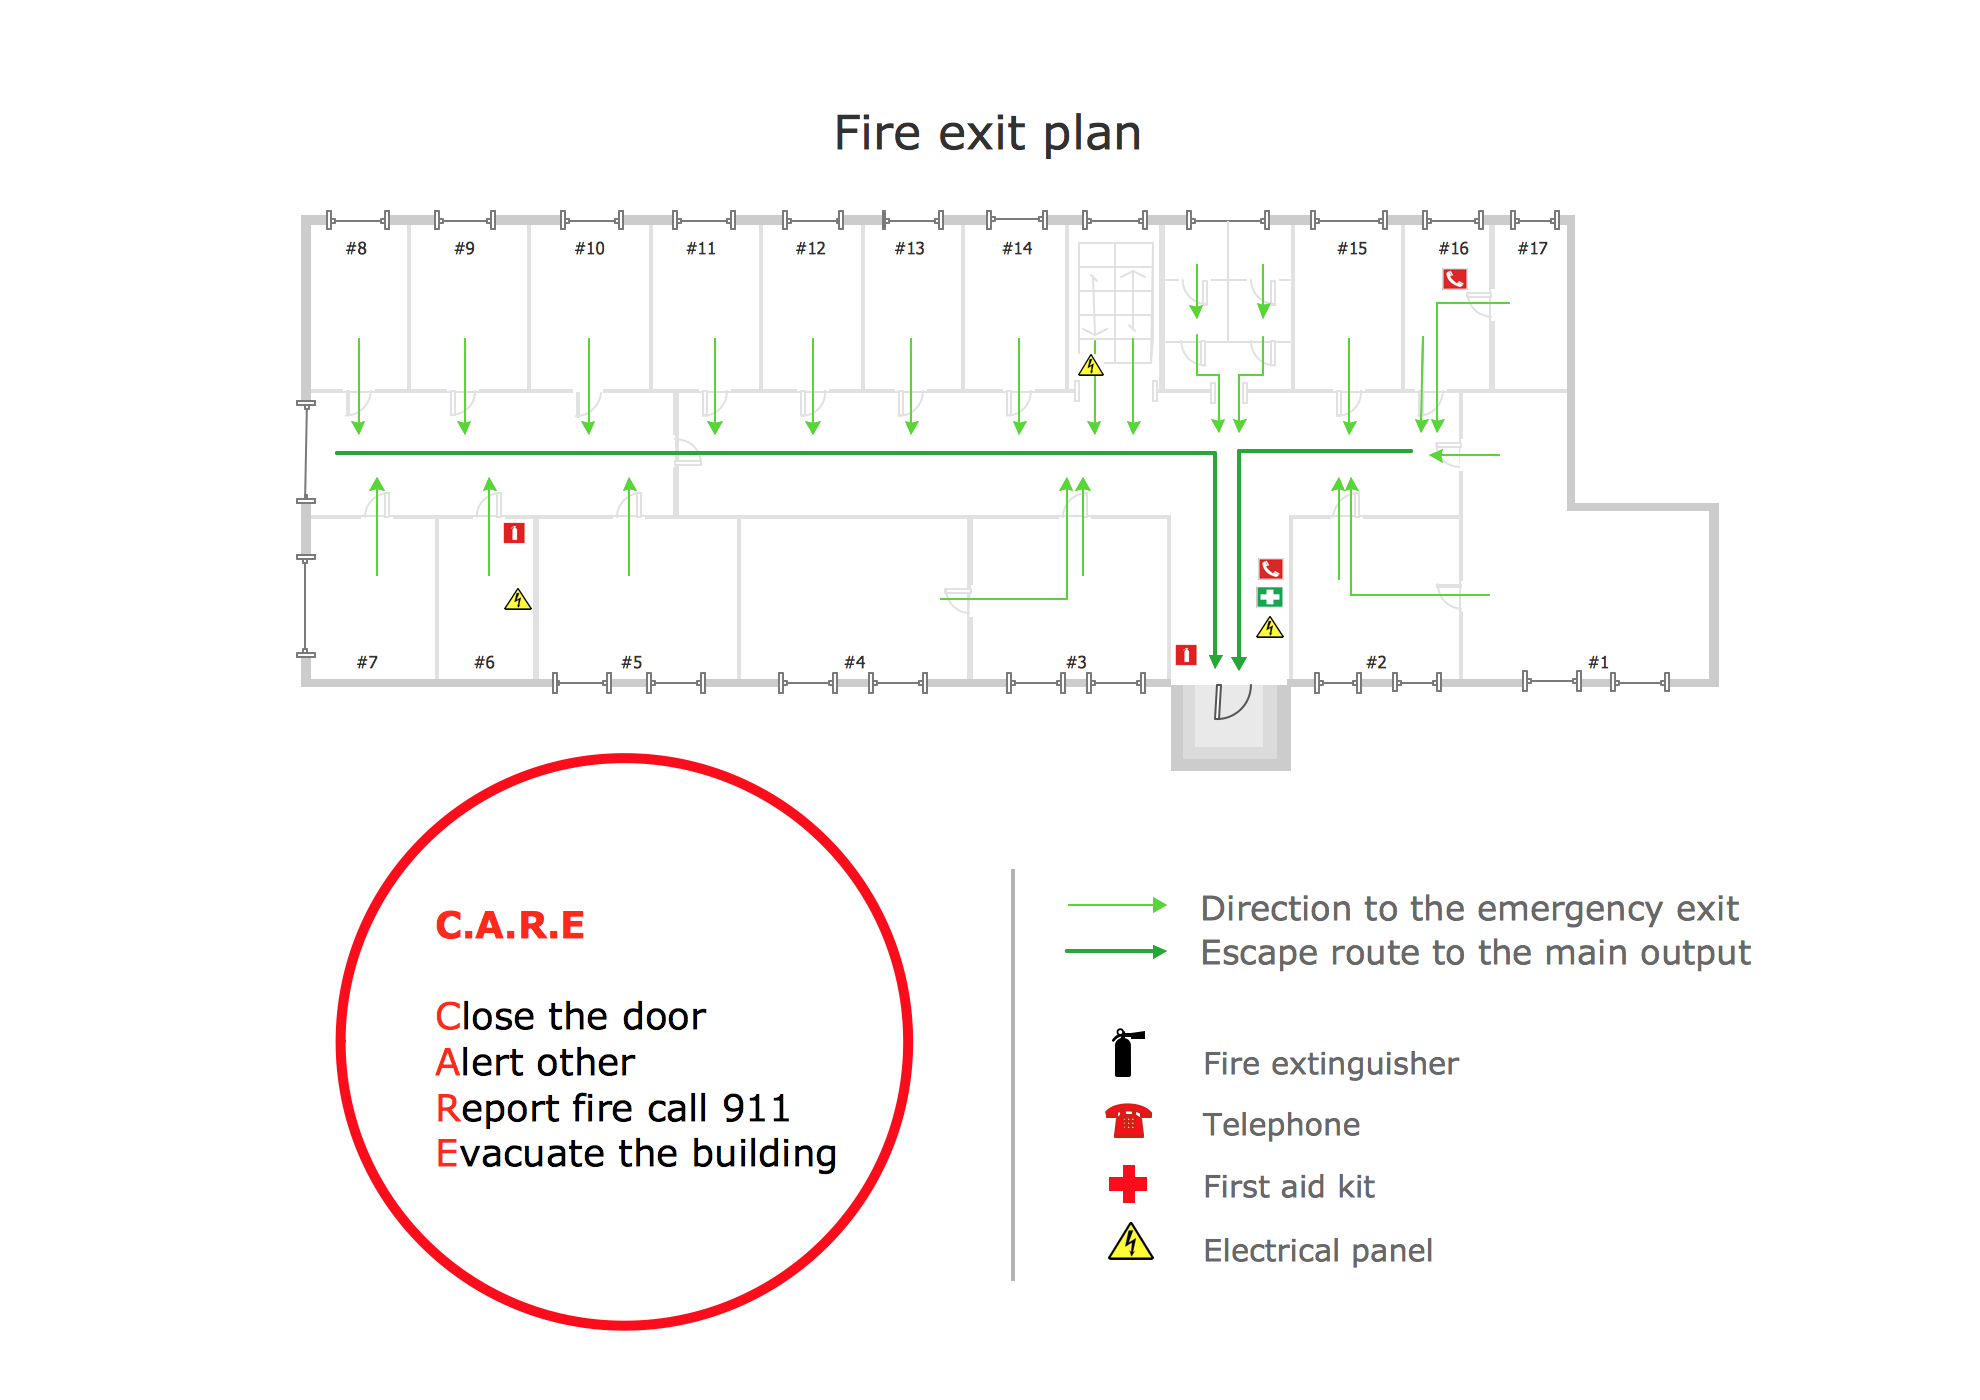
Fire exit plan or Emergency exit plan is an obligatory scheme for schools, universities, hospitals, hotels, business centers, metro, airports, and a lot of other buildings, public and private institutions. Fire exit plan depicts detailed plan of the building with marked emergency exits on it and helps to implement faster evacuation in various emergencies such as a fire. If a regular exit is blocked by fire, the plan helps to find the alternative exits, on the route to which are placed the signs leading to it. Fire and Emergency Plans solution from the Building Plans area of ConceptDraw Solution Park provides examples and samples, Fire and Emergency Plan quick-start template and vector stencils library with fire-fighting equipment design elements for drawing different types of emergency and fire schemes and plans: Evacuation plans, Fire Exit plans, Home Emergency plans, School Emergency plans, Office Emergency plans, Fire Emergency plans, Fire Evacuation plans, Fire Safety diagrams, Business Emergency plans, etc.ERD Symbols and Meanings
Entity Relationship Diagram (ERD) is a popular software engineering tool for database modeling and illustration the logical structure of databases, which uses one of two notations - Chen's or Crow’s Foot. Crow's foot notation is effective when used in software engineering, information engineering, structured systems analysis and design. Each of these notations applies its own set of ERD symbols. Crow's foot diagrams use boxes to represent entities and lines between these boxes to show relationships. Varied shapes at the ends of lines depict the cardinality of a given relationship. Chen's ERD notation is more detailed way to represent entities and relationships. ConceptDraw PRO application enhanced with all-inclusive Entity-Relationship Diagram (ERD) solution allows design professional ER diagrams with Chen's or Crow’s Foot notation on your choice. It contains the full set of ready-to-use standardized ERD symbols and meanings helpful for quickly drawing, collection of predesigned ERD samples, examples and templates. ConceptDraw Pro is a great alternative to Visio for Mac users as it offers more features and can easily handle the most demanding professional needs.
Entity Relationship Diagram Symbols
The semantic modeling method nowadays is successfully applied in database structure design. It is effective method of modeling the data structures, which is based on the meaning of these data. As a tool of semantic modeling, there are used different types of Entity-Relationship Diagrams. Entity Relationship Diagram (ERD) is applied to visually and clearly represent a structure of a business database. The main components of ERDs are: entity, relation and attributes. An entity is a class of similar objects in the model, each entity is depicted in the form of rectangle and has the name expressed by a noun. Relation is shown in the form of non-directional line that connects two entities. There are several notation styles used for ERDs: information engineering style, Chen style, Bachman style, Martin Style. The Entity Relationship Diagram symbols used for professional ERD drawing are predesigned by professionals and collected in the libraries of the Entity-Relationship Diagram (ERD) solution for ConceptDraw PRO software.How To use House Electrical Plan Software
How we can conduct the electricity at house correctly without a plan? It is impossible. The House electrical diagram depicts locations of switches, outlets, dimmers and lights, and lets understand how you will connect them. But design of House Electrical Plan looks a complex task at a glance, which requires a lot of tools and special experience. But now all is simple with all-inclusive floor plan software - ConceptDraw PRO. As a house electrical plan software, the ConceptDraw PRO contains libraries with a large range of professional lighting and electrical symbols, ready-to-use electrical plans samples and examples, and built-in templates for creating great-looking Home floor electrical plans. It is a fastest way to draw Electrical circuit diagrams, Electrical wiring and Circuit schematics, Digital circuits, Electrical equipment, House electrical plans, Satellite television, Cable television, Home cinema, Closed-circuit television when are used the tools of Electric and Telecom Plans Solution from ConceptDraw Solution Park. Files created in Visio for Mac app can be easily imported to ConceptDraw PRO. Also you may import stencils and even libraries. Try for free an alternative to Visio that Apple users recommend.
Basic Flowchart Symbols and Meaning
Flowcharts are the best for visually representation the business processes and the flow of a custom-order process through various departments within an organization. ConceptDraw PRO diagramming and vector drawing software extended with Flowcharts solution offers the full set of predesigned basic flowchart symbols which are gathered at two libraries: Flowchart and Flowcharts Rapid Draw. Among them are: process, terminator, decision, data, document, display, manual loop, and many other specific symbols. The meaning for each symbol offered by ConceptDraw gives the presentation about their proposed use in professional Flowcharts for business and technical processes, software algorithms, well-developed structures of web sites, Workflow diagrams, Process flow diagram and correlation in developing on-line instructional projects or business process system. Use of ready flow chart symbols in diagrams is incredibly useful - you need simply drag desired from the libraries to your document and arrange them in required order. There are a few serious alternatives to Visio for Mac, one of them is ConceptDraw PRO. It is one of the main contender with the most similar features and capabilities.
Audit Flowchart Symbols
The audit is a complex process consisting of defined quantity of steps, which have as a final goal the ensuring of success of a certain business project. It includes the independent examination of data, statements and financial performances of an enterprise for a stated purpose. It is convenient to construct the Audit Flowcharts or Audit Diagrams for visual representation and structuring the audit processes. ConceptDraw PRO diagramming software enhanced with Audit Flowcharts solution from the Finance and Accounting area of ConceptDraw Solution Park effectively helps to draw the Audit Diagrams for accounting, finance and money management, the Audit Flowcharts for fiscal information tracking, financial inventories and documenting Six Sigma, the decision making Flow Charts, etc. This solution provides the powerful drawing tools, numerous templates and samples, and large quantity of vector audit flowchart symbols that greatly facilitate the process of representation the audit steps and audit results, and designing efficient and visually appealing Audit Flowcharts.
 Decision Making
The Decision Making solution offers the set of professionally developed examples, powerful drawing tools and a wide range of libraries with specific ready-made vector decision icons, decision pictograms, decision flowchart elements, decision tree icons, decision signs arrows, and callouts, allowing the decision maker (even without drawing and design skills) to easily construct Decision diagrams, Business decision maps, Decision flowcharts, Decision trees, Decision matrix, T Chart, Influence diagrams, which are powerful in questions of decision making, holding decision tree analysis and Analytic Hierarchy Process (AHP), visual decomposition the decision problem into hierarchy of easily comprehensible sub-problems and solving them without any efforts.
Process Flowchart
The main reason of using Process Flowchart or PFD is to show relations between major parts of the system. Process Flowcharts are used in process engineering and chemical industry where there is a requirement of depicting relationships between major components only and not include minor parts. Process Flowcharts for single unit or multiple units differ in their structure and implementation. ConceptDraw PRO is Professional business process mapping software for making Process flowcharts, Process flow diagram, Workflow diagram, flowcharts and technical illustrations for business documents and also comprehensive visio for mac application. Easier define and document basic work and data flows, financial, production and quality management processes to increase efficiency of your business with ConcepDraw PRO. Business process mapping software with Flowchart Maker ConceptDraw PRO includes extensive drawing tools, rich examples and templates, process flowchart symbols and shape libraries, smart connectors that allow you create the flowcharts of complex processes, process flow diagrams, procedures and information exchange. Process Flowchart Solution is project management workflow tools which is part ConceptDraw Project marketing project management software. Drawing charts, diagrams, and network layouts has long been the monopoly of Microsoft Visio, making Mac users to struggle when needing such visio alternative like visio for mac, it requires only to view features, make a minor edit to, or print a diagram or chart. Thankfully to MS Visio alternative like ConceptDraw PRO software, this is cross-platform charting and business process management tool, now visio alternative for making sort of visio diagram is not a problem anymore however many people still name it business process visio tools.
HelpDesk
How to Make a Basketball Court Diagram
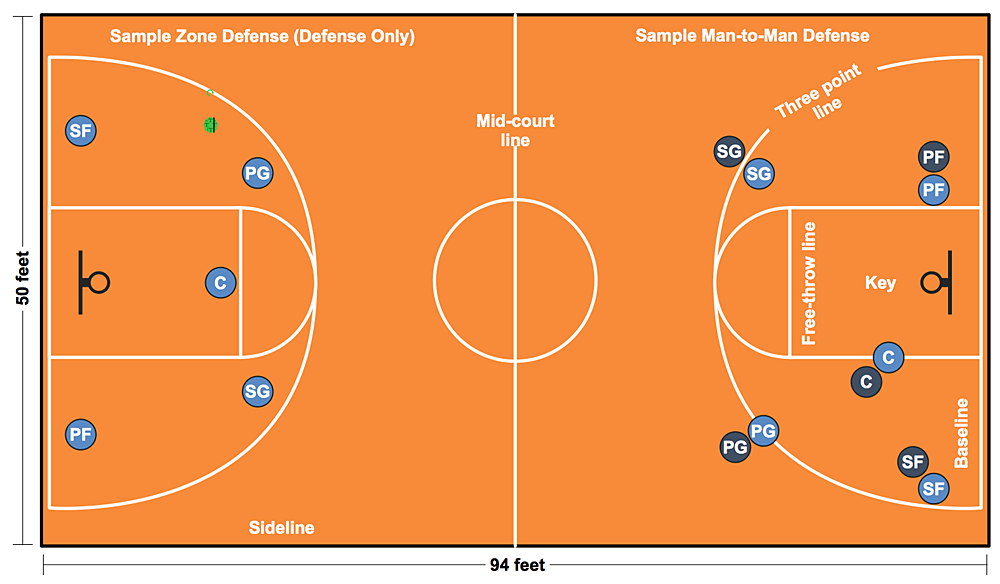
Basketball Court diagrams is often used as a teaching and learning tool for coaches, players and parents to describe the basketball moves and shooting drills. The ability to create Basketball diagrams with ConceptDraw PRO is contained in the Basketball solution. It provides a set of special tools for creating different Basketball diagrams. Basketball court diagram is used to describe basketball moves and shooting drills during the discussion of the match, as well as to develop a winning defense and attack strategy as a clear visual plans for future games.- Making Small Signs
- Basic Flowchart Symbols and Meaning | Sign Making Software ...
- Visible light communication | Road signs - Vector stencils library ...
- Sign Making Software | Design Pictorial Infographics. Design ...
- Directional Maps | DroidDia PRO unlocker | How to Create a ...
- Recreation signs - Vector stencils library | Design elements ...
- Recreation signs - Vector stencils library | Road signs - Vector ...
- Mind Map Making Software | Sign Making Software | Concept Map ...
- Sign Making Software | Flyer Templates | Advertising creation ...
- Sign Making Software | Flyer Templates | SWOT Analysis | Free ...


