This site uses cookies. By continuing to browse the ConceptDraw site you are agreeing to our Use of Site Cookies.

Business Graphics Software

ConceptDraw DIAGRAM is a business graphics software that allows you improve your business using Sales Performance Dashboard helps you analyze your data more efficiently.
HelpDesk

How to Use ConceptDraw Sales Dashboard Solution

An interactive visual dashboard is a valuable tool for any sales team. Sales dashboard allows you to view and monitor sales indicators that are important for manager and sales staff. It helps to use timely and reliable information to improve the quality of sales performance and increase sales revenues. ConceptDraw Sales Dashboard solution is a tool for both: sales manager and sales team. It provides the visualization of key performance indicators that are critical to the entire sales organization. The custom sales dashboard displays real-time information on sales performance KPIs with the help of intuitive and easy-to-understand diagrams and charts. Sales Dashboard helps the entire team see where they are, and what needs to be done. With ConceptDraw DIAGRAM you can easily create a visual Sales Dashboard using Live Objects Technology.

ConceptDraw Solution Park ConceptDraw Solution Park

ConceptDraw Solution Park
ConceptDraw Solution Park collects graphic extensions, examples and learning materials

BPMN standard, Business Process Diagram, BPMN, Business Process Business Process Diagrams

BPMN standard, Business Process Diagram, BPMN, Business Process
Business Process Diagrams solution extends the ConceptDraw DIAGRAM BPM software with RapidDraw interface, templates, samples and numerous libraries based on the BPMN 1.2 and BPMN 2.0 standards, which give you the possibility to visualize equally easy simple and complex processes, to design business models, to quickly develop and document in details any business processes on the stages of project’s planning and implementation.

The Facts and KPIs

Visualizing sales data help you see the facts and KPIs about your sales process to make conclusions and see how your business can improve.

Business Diagram Software

ConceptDraw business diagram Software is the most powerful business and relational charting software. Create advanced, completely customizable flow charts, organizational charts, business process diagrams, work flow diagrams, audit diagram, value stream maps, TQM diagrams, ERD diagrams, EPC diagrams, marketing diagrams, cause and effect diagrams, dashboards, infographics and other relational business diagrams from your data.
Business Process Modeling

Performance Indicators

ConceptDraw DIAGRAM diagramming and vector drawing software offers the useful tools of the Sales Dashboard solution from the Marketing area for easy creating professional looking live dashboards which allow to track the business sales activity and progress thanks to representing the Key Performance Indicators (KPIs) on them.
HelpDesk

How to Create Multple Projects Schedule on Windows

ConceptDraw PROJECT is simple project scheduling software, it allows grouping individual projects into multiple projects that can use a common resource pool and a synchronized task schedule. You can create a detailed schedule of your multiple projects quickly and easy with ConceptDraw PROJECT. When considering project change requests, a project manager can model their interaction by grouping or dividing into sub-projects. It includes useful critical path scheduling software tools. The Multiproject Dashboard mode enables planning and managing several projects simultaneously using the single resource pool for all projects. The Multiproject Dashboard mode helps you plan multiple projects while providing you with the overall view.
HelpDesk

How to Create the Custom Diagram Template
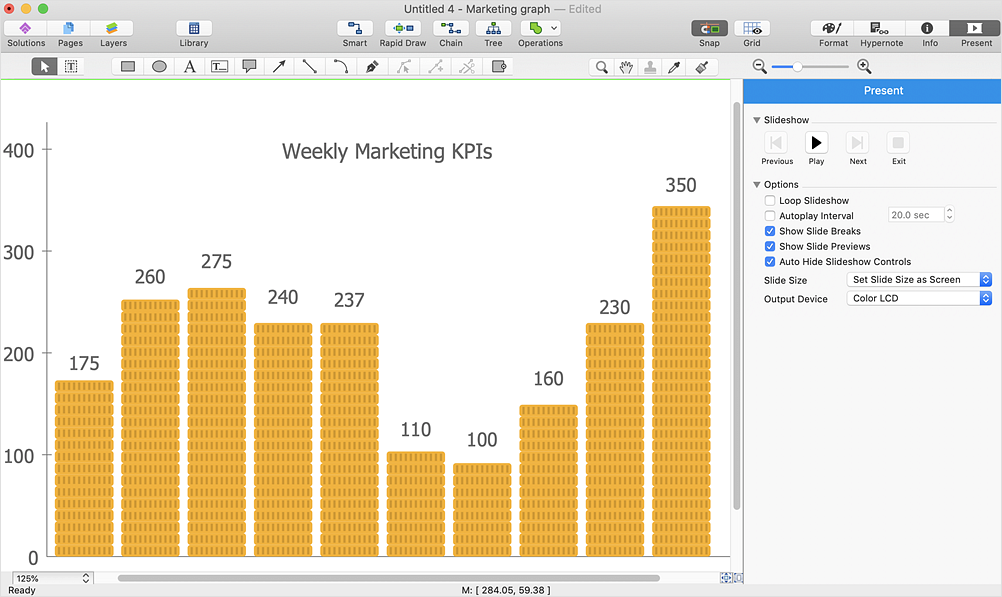
ConceptDraw DIAGRAM enables you to place your own templates. You can create a diagram with ConceptDraw DIAGRAM using your custom Template. You can set up your Template as a default ConceptDraw DIAGRAM start page. A template diagram is a drawing that serves as a starting point for a new graphic document. When you open a template, it is pre-formatted in some way. For example, you might use template that is formatted as an organizational chart. The template would likely have a workspace and a corresponding object libraries. When you save a file created with a template, you are usually prompted to a copy of the a, so that you don't save over the supplied with. customize your can either come with a proper solution or can be created by the user. If you find yourself creating similar documents over and over again, it might be a good idea to save one of them as a template. Then you won't have to format your template that each time you want to make a new one. Just open the template and start from there.

KPI Dashboard

ConceptDraw DIAGRAM diagramming and vector drawing software supplied with Sales Dashboard solution from the Marketing area of ConceptDraw Solution Park provides the full set of useful tools which make it the best for producing the live KPI Dashboard of any complexity.

cross-functional flowchart template, flowchart, example business process flow Cross-Functional Flowcharts

cross-functional flowchart template, flowchart, example business process flow
Cross-functional flowcharts are powerful and useful tool for visualizing and analyzing complex business processes which requires involvement of multiple people, teams or even departments. They let clearly represent a sequence of the process steps, the order of operations, relationships between processes and responsible functional units (such as departments or positions).

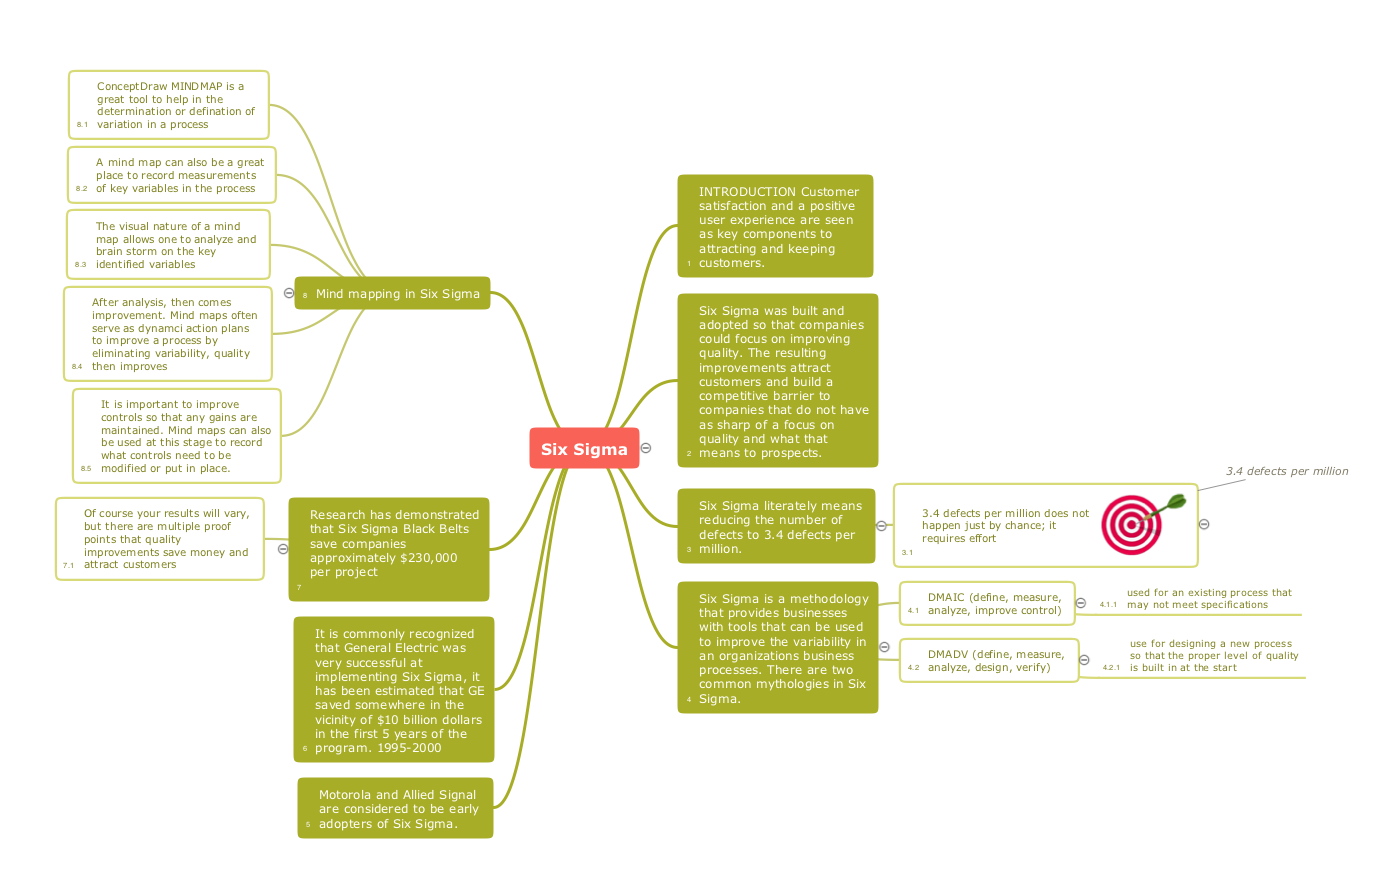
TQM Diagram — Professional Total Quality Management

The Total Quality Management Diagram solution helps you and your organization visualize business and industrial processes. Create Total Quality Management diagrams for business process with ConceptDraw software.
HelpDesk

How To Create a MS Visio Business Process Diagram

Business process diagrams are specialized types of flowcharts based on the Business Process Model and Notation. The BPMN specification describes the symbols to display business processes in the form of business process diagrams. The main objective of BPMN is to create a standard set of symbols that are understandable to all business users, such as business analysts who create and improve processes, technical developers responsible for implementing processes and managers who take care processes and control them. Making a business process diagram involves many different elements that can be managed using ConceptDraw DIAGRAM. The ability to design Business process diagrams is delivered by the Business Process Diagrams solution. ConceptDraw DIAGRAM supports export of business process diagrams to MS Visio files. Thus, you can share your business documentation with MS Visio users.

How To Create Project Report

ConceptDraw PROJECT contains an extensive tool set to help project managers. The rich data visualization capability that is provided by ConceptDraw products helps you create project dashboards, one-click reports, multi-project views, Gantt charts, and resource views. Let′s learn how to get maximum value using ConceptDraw PROJECT!

Constant improvement of key performance indicators

There are available tool to lend a fresh look to quality procedures - ConceptDraw MINDMAP.