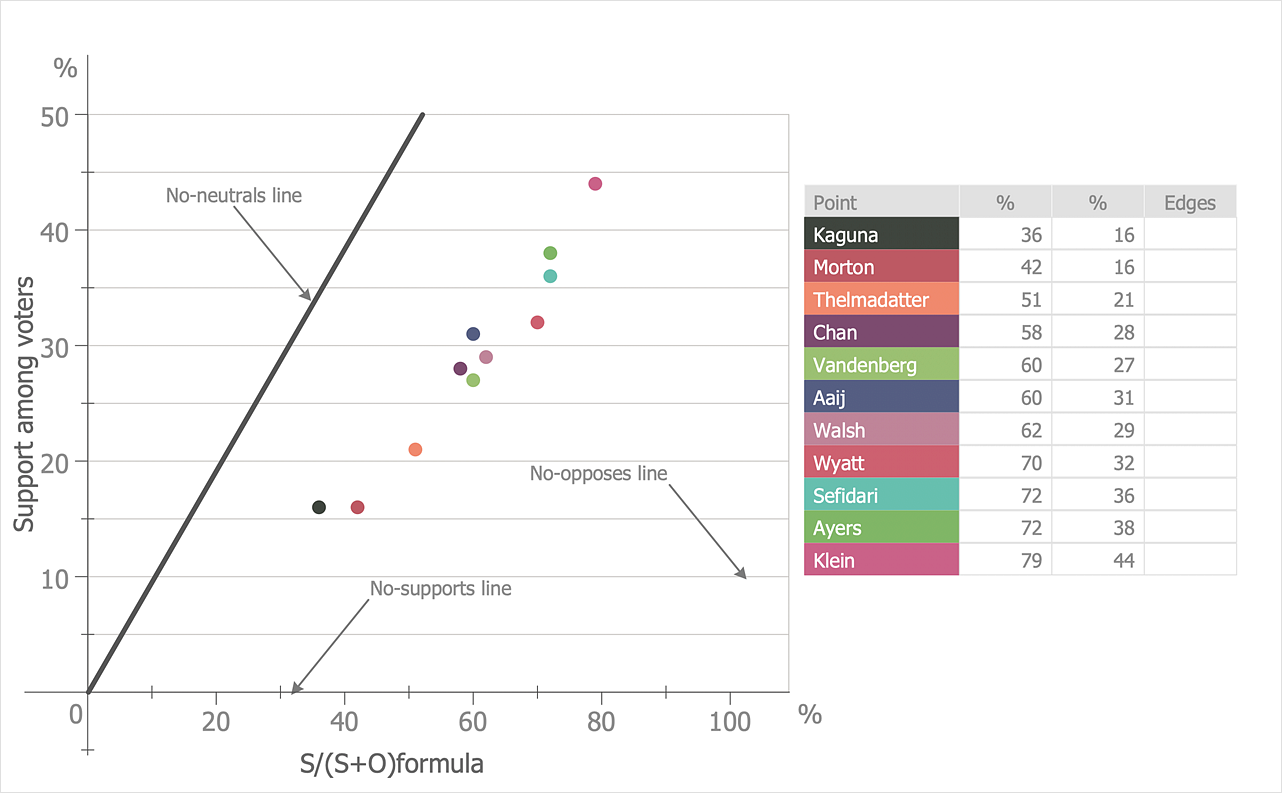
How To Make a Bubble Chart
Bubble diagrams solution extends ConceptDraw DIAGRAM software with templates, Using ConceptDraw Connectors, you can make a bubble chart in moments. Using ConceptDraw you will be able to make a bubble chart from the ready ConceptDraw library objects or make your own objects. The created diagram can represent ideas organization, in brainstorming processes, by teachers for explaining difficult ideas or for presentations.How To Create a Bubble Chart
Bubble diagrams solution extends ConceptDraw DIAGRAM software with templates, Using ConceptDraw Connectors, you can create a bubble chart in moments. Using ConceptDraw you will be able to create a bubble chart from the ready ConceptDraw library objects or make your own objects. The created diagram can represent ideas organization, in brainstorming processes, by teachers for explaining difficult ideas or for presentations.Bubble Chart
How to design a Bubble Chart? It’s very easy! All that you need is a powerful software. Never before creation of a Bubble Chart wasn’t so easy as now with tools of Bubble Diagrams Solution from the "Diagrams" Area for ConceptDraw Solution Park.Bubble Chart Maker
ConceptDraw DIAGRAM diagramming and vector drawing software extended with Bubble Diagrams Solution from the "Diagrams" Area is a powerful Bubble Chart Maker.HelpDesk
How to Add a Bubble Diagram to PowerPoint Presentation
Bubble diagrams can be used to compare concepts, and identify areas of similarity and difference. ConceptDraw DIAGRAM allows you to make a MS PowerPoint Presentation from your charts in a few simple steps.Bubble Charts
Bubble Charts are convenient way to visualize ideas and concepts by organizing them in a hierarchy. To show the importance of ideas you can use different bubble sizes and colors. ConceptDraw DIAGRAM diagramming and vector drawing software extended with Bubble Diagrams Solution from the "Diagrams" Area affords you the easiest and fastest way for designing professional looking Bubble Charts.HelpDesk
How to Create Organizational Chart Quickly
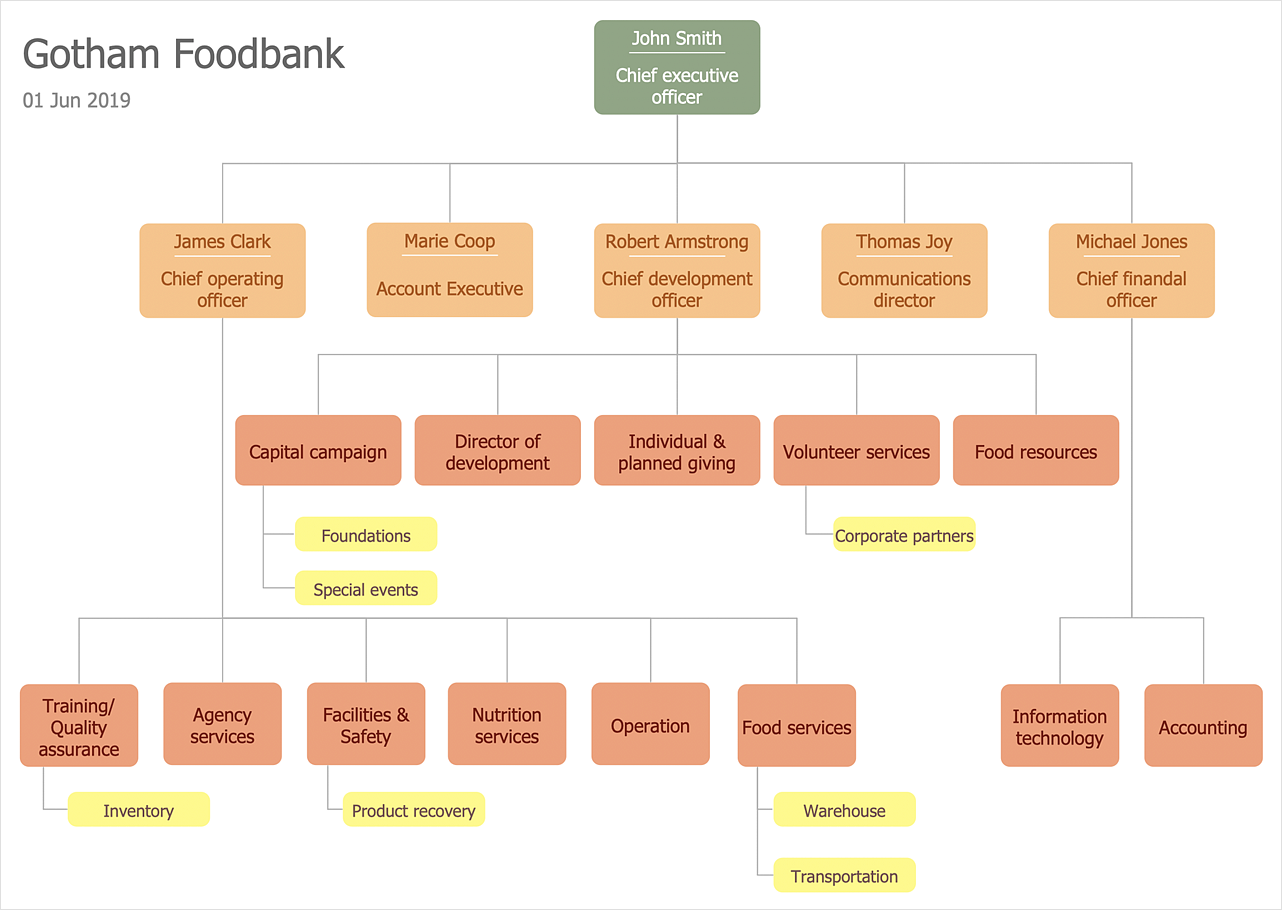
Use ConceptDraw MINDMAP for generating structured data on organization structure and then ConceptDraw DIAGRAM for presenting the results as chart.Bubble diagrams in Landscape Design with ConceptDraw DIAGRAM
Bubble Diagrams are the charts with a bubble presentation of data with obligatory consideration of bubble's sizes. They are analogs of Mind Maps and find their application at many fields, and even in landscape design. At this case the bubbles are applied to illustrate the arrangement of different areas of future landscape design, such as lawns, flowerbeds, playgrounds, pools, recreation areas, etc. Bubble Diagram helps to see instantly the whole project, it is easy for design and quite informative, in most cases it reflects all needed information. Often Bubble Diagram is used as a draft for the future landscape project, on the first stage of its design, and in case of approval of chosen design concept is created advanced detailed landscape plan with specification of plants and used materials. Creation of Bubble Diagrams for landscape in ConceptDraw DIAGRAM software is an easy task thanks to the Bubble Diagrams solution from "Diagrams" area. You can use the ready scanned location plan as the base or create it easy using the special ConceptDraw libraries and templates.HelpDesk
How to Make an Ansoff Matrix Template
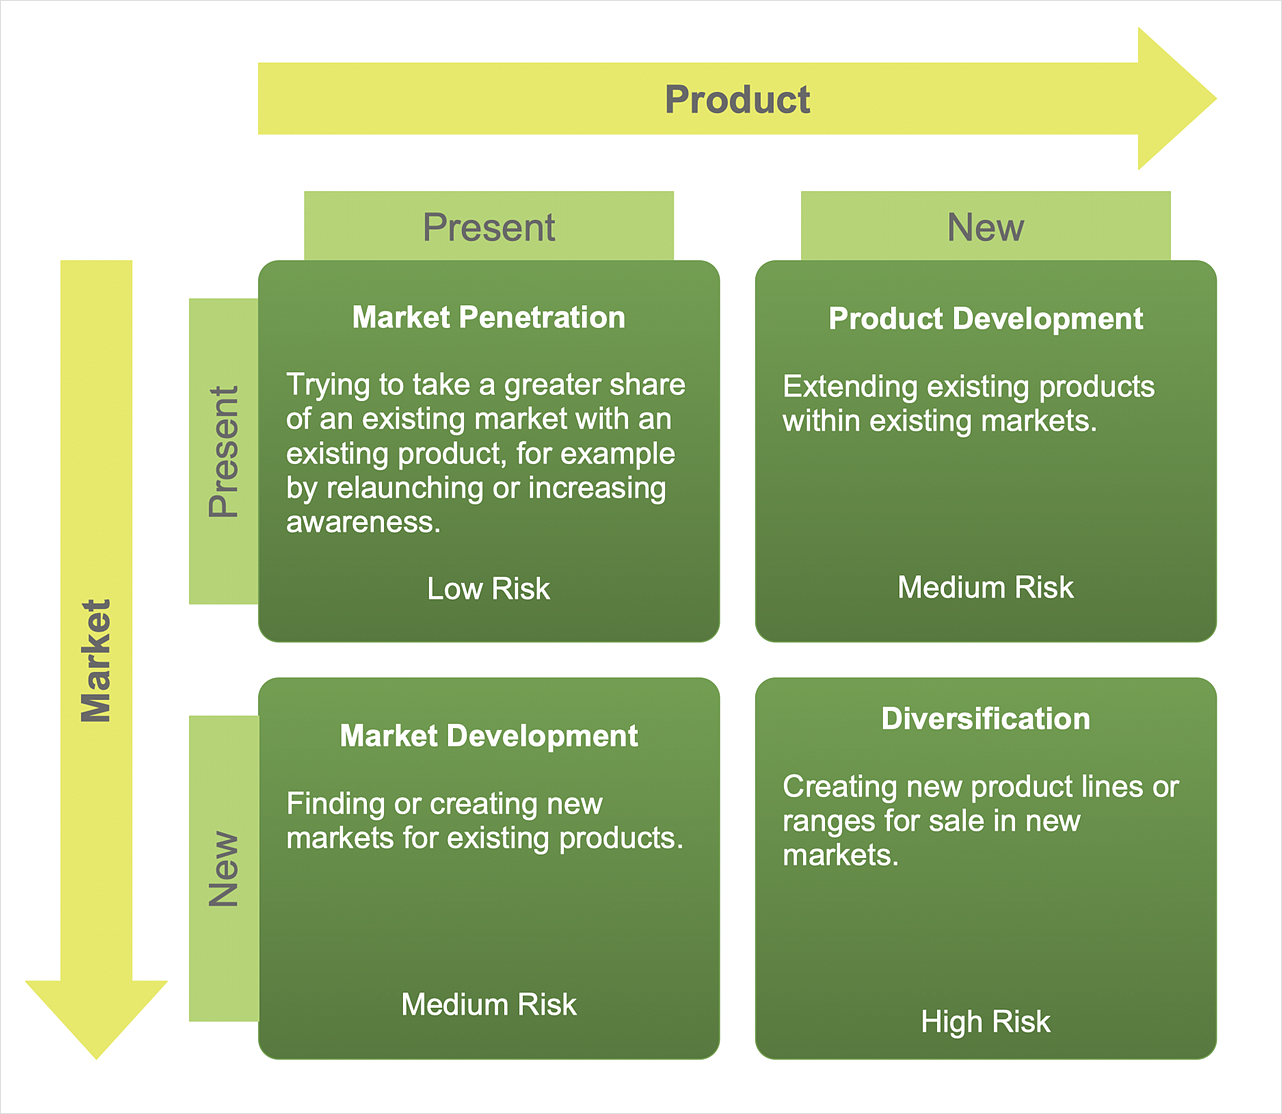
Ansoff Matrix is a business strategic management tool that helps a business determine its product and market growth strategy. Ansoff matrix has four sections to show each impacting ways that businesses can grow. Using Ansoff Matrix enables determining the current position of any business in the industry and choose the direction of its growth, which would provide the most competitive position. While Ansoff Matrix is most commonly used as a business planning tool it can be used also for personal development. You can make Ansoff Matrix template for your organization using ConceptDraw DIAGRAM Matrices solution.HelpDesk
How to Create a Bubble Diagram
Bubble Diagram is a simple chart that consists of circles (bubbles) repesening certain topics or processes. Bubbles are connected by lines depicting the type of relationships between the bubbles. The size of each bubble is depended on the importance of the entity it represents. Bubble charts are widely used throughout social, economical, medical, and other scientific researches as well as throughout architecture and business management. Bubble charts are often used during the early stages of product development to visualize thoughts and ideas for the purpose of sketching out a development plan. ConceptDraw DIAGRAM allows you to draw a bubble diagrams using the Bubble Diagrams solution.HelpDesk
How to Create a Timeline Diagram
A Timeline is a chart which displays a project plan schedule in chronological order. A Timeline is used in project management to depict project milestones and visualize project phases and show project progress. The graphic form of a timeline makes it easy to understand critical project milestones, such as the progress of a project schedule. Timelines are particularly useful for project scheduling or project management when accompanied with a Gantt chart. It captures the main of what the project will accomplish and how it will be done. making a project timeline is one of the most important skills a project manager needs have. Making comprehensive, accurate timelines allows you getting every project off in the best way. ConceptDraw DIAGRAM allows you to draw a timeline chart using a special library.HelpDesk
How to Draw a Gantt Chart
A Gantt chart is intended to provide a visualization of a project schedule. It is developed to help planning, coordinating, and tracking on project tasks implementation. One of the most critical resources for project implementation are time resources. Gantt chart - is one of the most convenient and popular ways of graphical representation of a project tasks progress in conjunction with the corresponding time consumption. Gantt chart's function is to show project tasks completed in progress and to make a project manager sure that project tasks were completed on time. ConceptDraw Office is a clear and easy-to-use tool for project management. It is a very handy visual tool that helps make a project processing clear.Basic Diagramming
Create flowcharts, organizational charts, bar charts, line graphs, and more with ConceptDraw DIAGRAM.
Best Program to Make Diagrams
Make diagrams, charts, workflows, flowcharts, org charts, project charts easily with ConceptDraw software.
Best Diagramming
Need to draw a diagram, process chart, flowchart, organizational chart, graphic design? ConceptDraw can help you to make professional graphic documents quickly.
HelpDesk
How To Create a PERT Chart Using PM Easy Solution
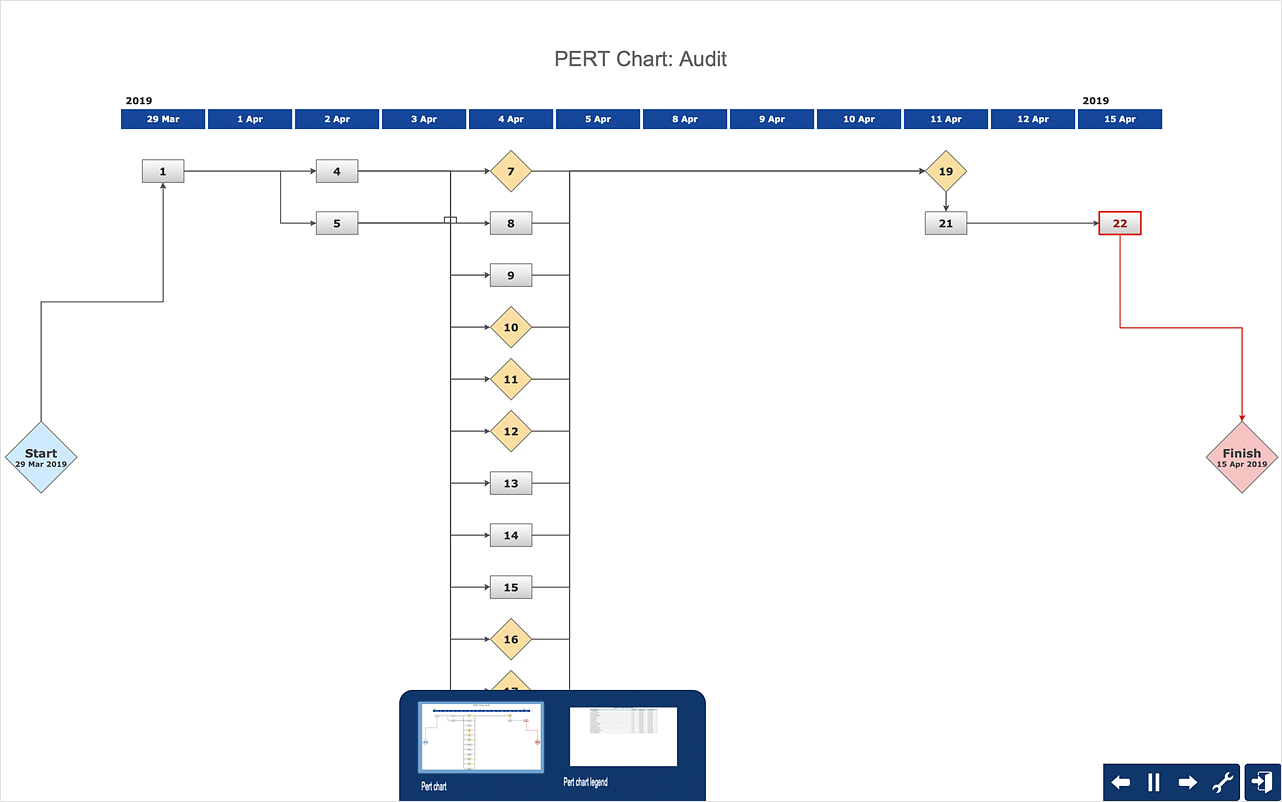
Project Evaluation and Review Technique (PERT) is a method of project tasks evaluation and analysis. PERT - is a method of analyzing the tasks required to complete the project. It includes analysis of the time required to complete each task, as well as the determination of the time required to carry out the whole project. PERT was developed to facilitate the planning of huge and complex projects. PERT is used for very large, complex, and non-standard projects. Technology implies the presence of uncertainty, making it possible to develop a schedule of the project without a precise information on details and time required for all of its components. The most popular part of PERT is a method of the critical path, based on the construction of the network schedule (PERT network diagram). ConceptDraw Office delivers you the best way to create PERT chart for your project using compatibility between ConceptDraw PROJECT and ConceptDraw DIAGRAM.HelpDesk
How to Draw a Histogram
A histogram is a diagram used to visualize data through bars of variable heights. Making histogram can be helpful if you need to show data covering various periods (hours, days, weeks, etc). When the vertical column of the histogram refers to the frequency it shows how many times an event happens. It is a Frequency Histogram. A bar chart diagram is similar to a histogram, but in contrast to a bar chart, a histogram represents the number how many times there have been certain data values. You can use a histogram to depict continual data flow such as temperature, time, etc. You can effortlessly draw histograms using the Histograms solution for ConceptDraw DIAGRAM. Making a histogram can be very useful to represent various statistical data.Program to Make Flow Chart
Use ConceptDraw DIAGRAM diagramming and business graphics software for drawing your own PM life cycle flow charts.HelpDesk
How to Draw an Organizational Chart
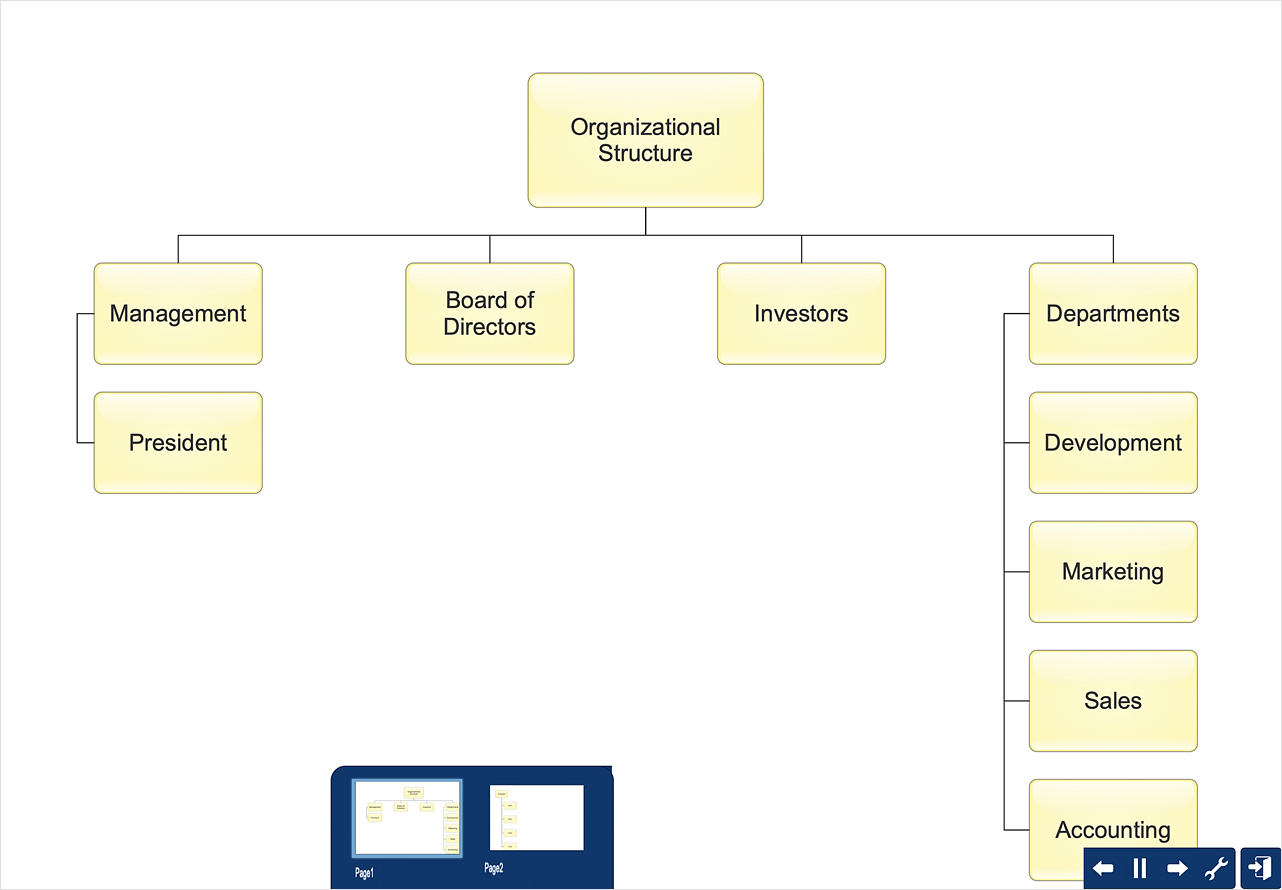
Polish your diagram appearance using the tools provided in the Format panel. The organizational chart software is a valuable tool for modern business. It is important for any business to build a clear organizational structure that determines the responsibilities and relationships between different positions in the organization. The clear structured organization - means the clear structured business workflow, which is the core of success in the business. ConceptDraw DIAGRAM is an org chart software that allows you to draw an organizational structure of your company quickly and easily.HelpDesk
How to Draw a Scatter Diagram
Scatter Diagrams are used to visualize how a change in one variable affects another. A Scatter Diagram displays the data as a set of points in a coordinate system. It combines these values into single data points and displays them in uneven intervals. A Scatter Diagram can be very useful for identifying relationships between variables, for example, the relationship between price and quality rating. Making a Scatter Diagram involves many different elements that can be managed using ConceptDraw Scatter Diagram solution.- How to Draw a Bubble Chart | How To Create a Bubble Chart | How ...
- How To Create a Visio Bubble Chart Using ConceptDraw PRO ...
- How To Create a Bubble Chart | Best Diagramming Software for Mac ...
- How to Draw a Bubble Chart | How To Make a Bubble Chart | How ...
- Bubble diagrams with ConceptDraw PRO | How to Draw a Bubble ...
- Bubble Chart | Bubble Charts | How To Make a Bubble Chart
- How To Make a Bubble Chart | How To Create a Bubble Chart ...
- Best Diagramming Software for Mac | How To Create a Bubble Chart ...
- Bubble Diagrams | Bubble Chart | How to Create a Bubble Diagram ...
- Blank Scatter Plot | Four Dimensions Bubble Plot | Scatter Plot ...
- Cross-Functional Process Map Template | How To Make a Bubble ...
- How To Create a Bubble Chart | How to Draw a Bubble Chart | How ...
- Bubble Chart
- Bubble diagrams in Landscape Design with ConceptDraw PRO ...
- How to Draw a Bubble Chart | How to Create a Bubble Diagram ...
- How to Draw a Bubble Chart | How To Create a Bubble Chart | How ...
- How to Draw a Bubble Chart | How To Make a Bubble Chart ...
- How To Make a Bubble Chart | Bubble diagrams with ConceptDraw ...
- How To Make a Bubble Chart | Cross-Functional Flowchart ...
- Bubble Chart


