Map Software
Create maps, flags, and more with ConceptDraw
 Continent Maps
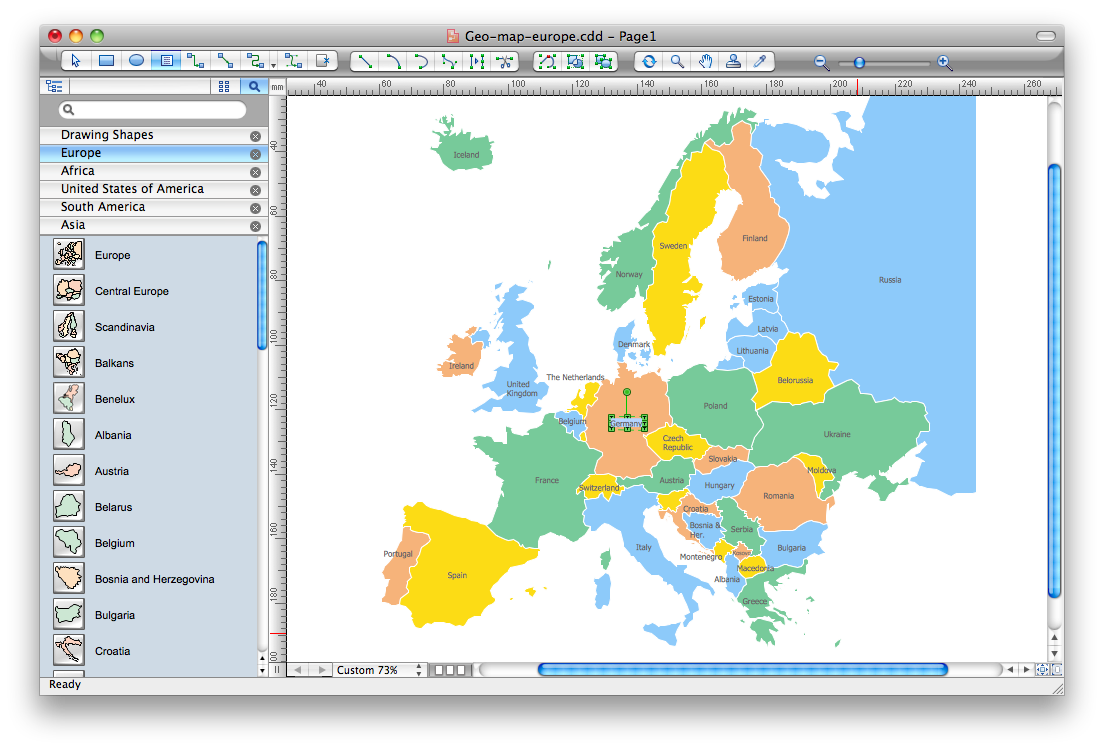
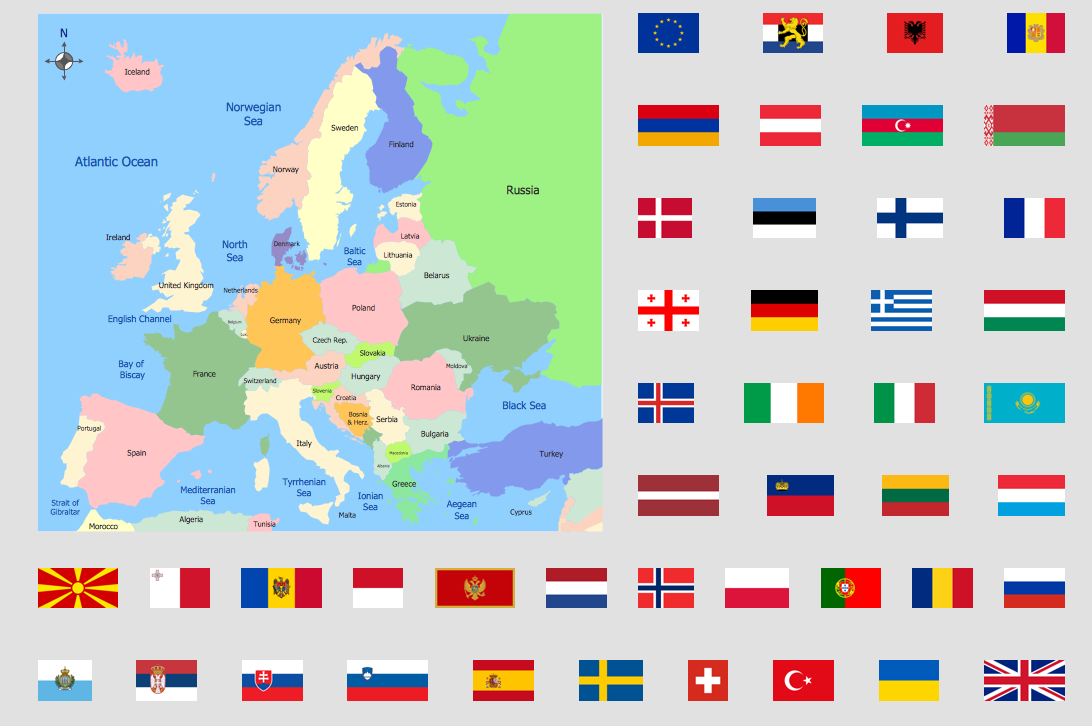
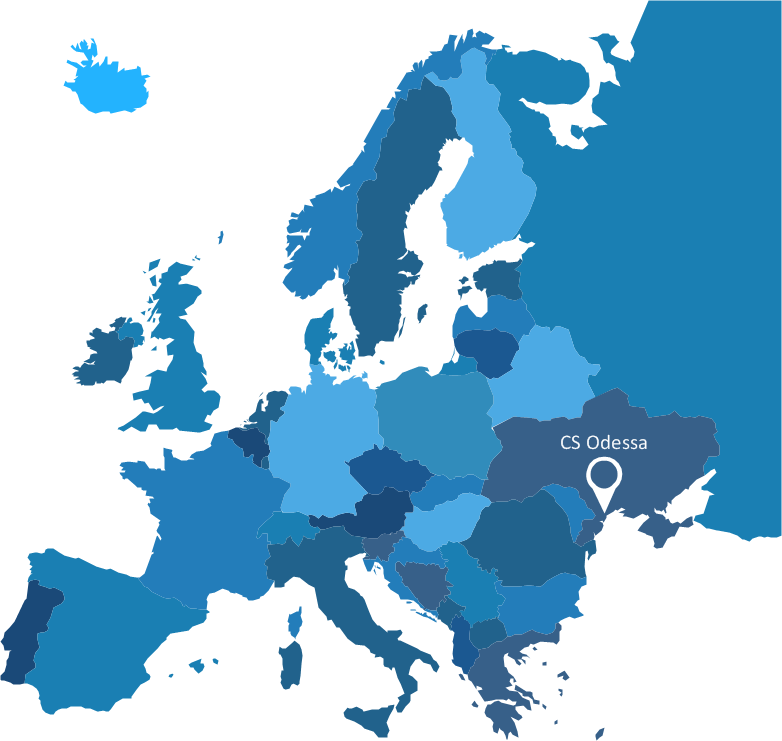
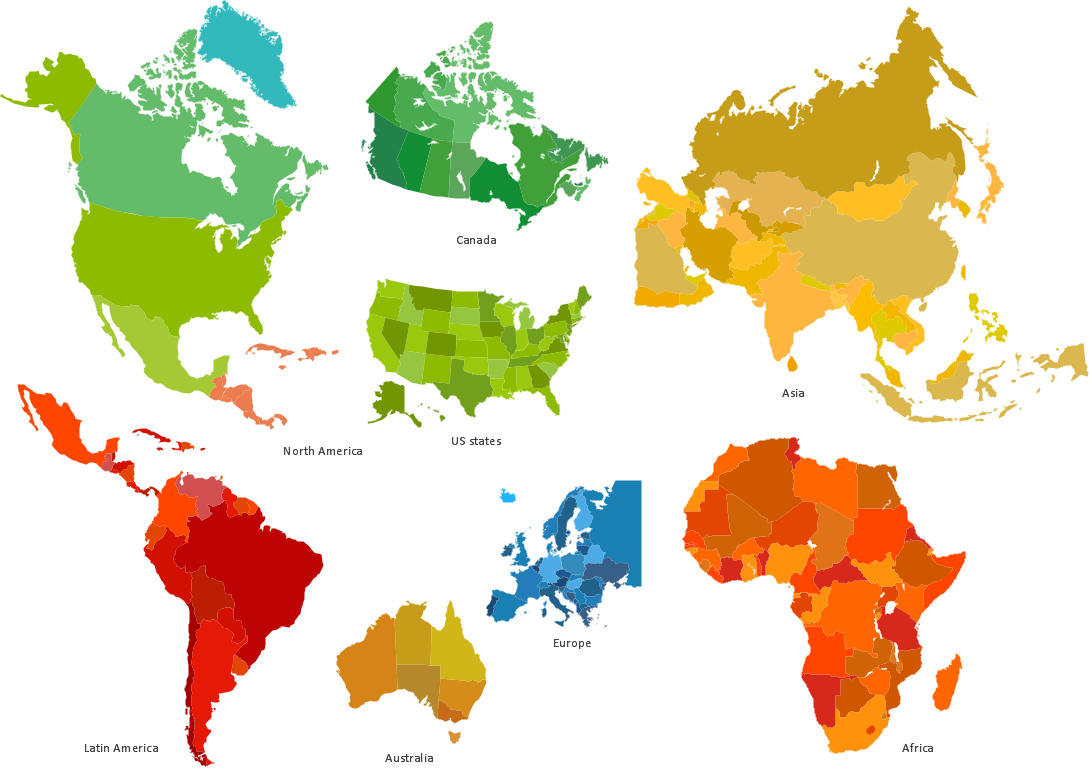
Continent Maps solution extends ConceptDraw PRO software with templates, samples and libraries of vector stencils for drawing the thematic maps of continents, state maps of USA and Australia.
World Continents Map
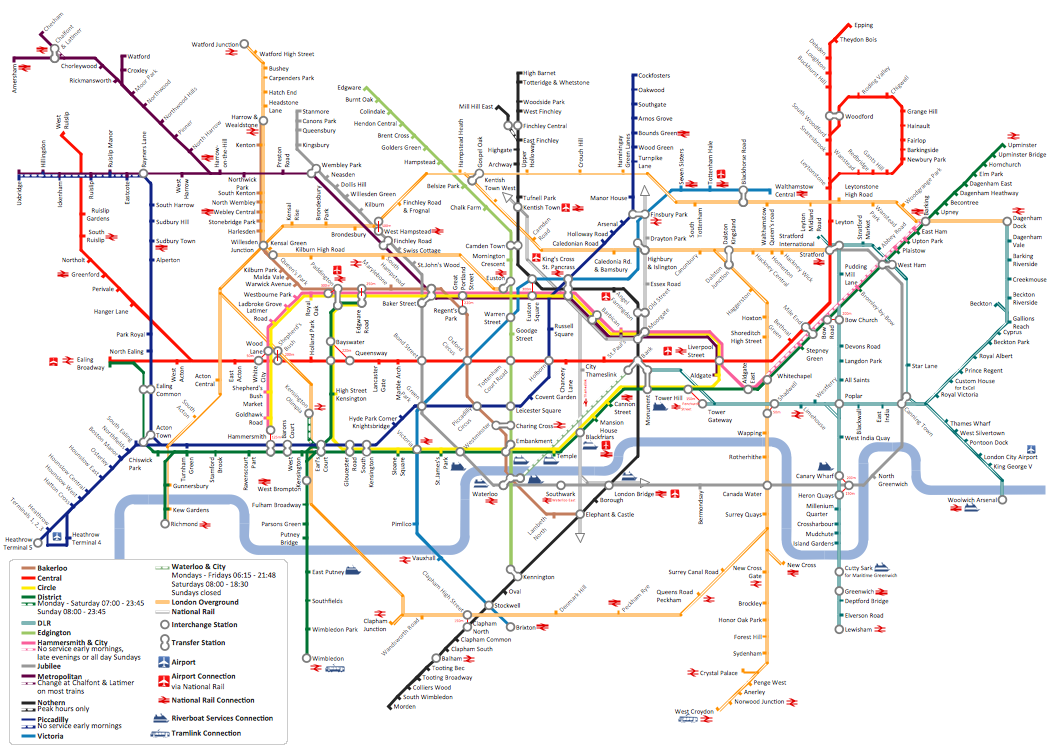
ConceptDraw PRO diagramming and vector drawing software enhanced with Continent Maps Solution from the Maps Area is the best for drawing geographic, topography, political, and many other kinds of maps for any of seven earth continents and also world continents map of any detailing.How to draw Metro Map style infographics? (London)
Tool to draw Metro Map styled inforgraphics. London Tube map sample.Geo Map - USA - Wisconsin
Wisconsin is a U.S. state located in the north-central United States, in the Midwest and Great Lakes regions. The vector stencils library Wisconsin contains contours for ConceptDraw PRO diagramming and vector drawing software. This library is contained in the Continent Maps solution from Maps area of ConceptDraw Solution Park.How To Draw a Diagram
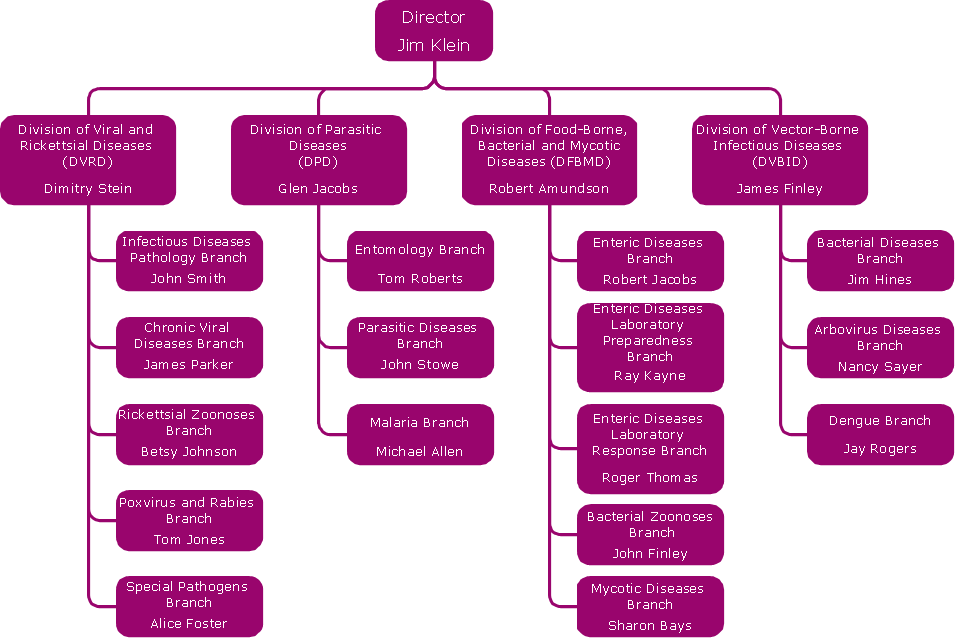
Is it possible to draw a diagram as quickly as the ideas come to you? The innovative ConceptDraw Arrows10 Technology included in ConceptDraw PRO is a simple and powerful tool to create any type of diagram. You mau choose to start from one of plenty diagram templates or to use your own idea.Spatial infographics Design Elements: Location Map
Infographic Design Elements for visually present various geographically distributed information.Australia Map
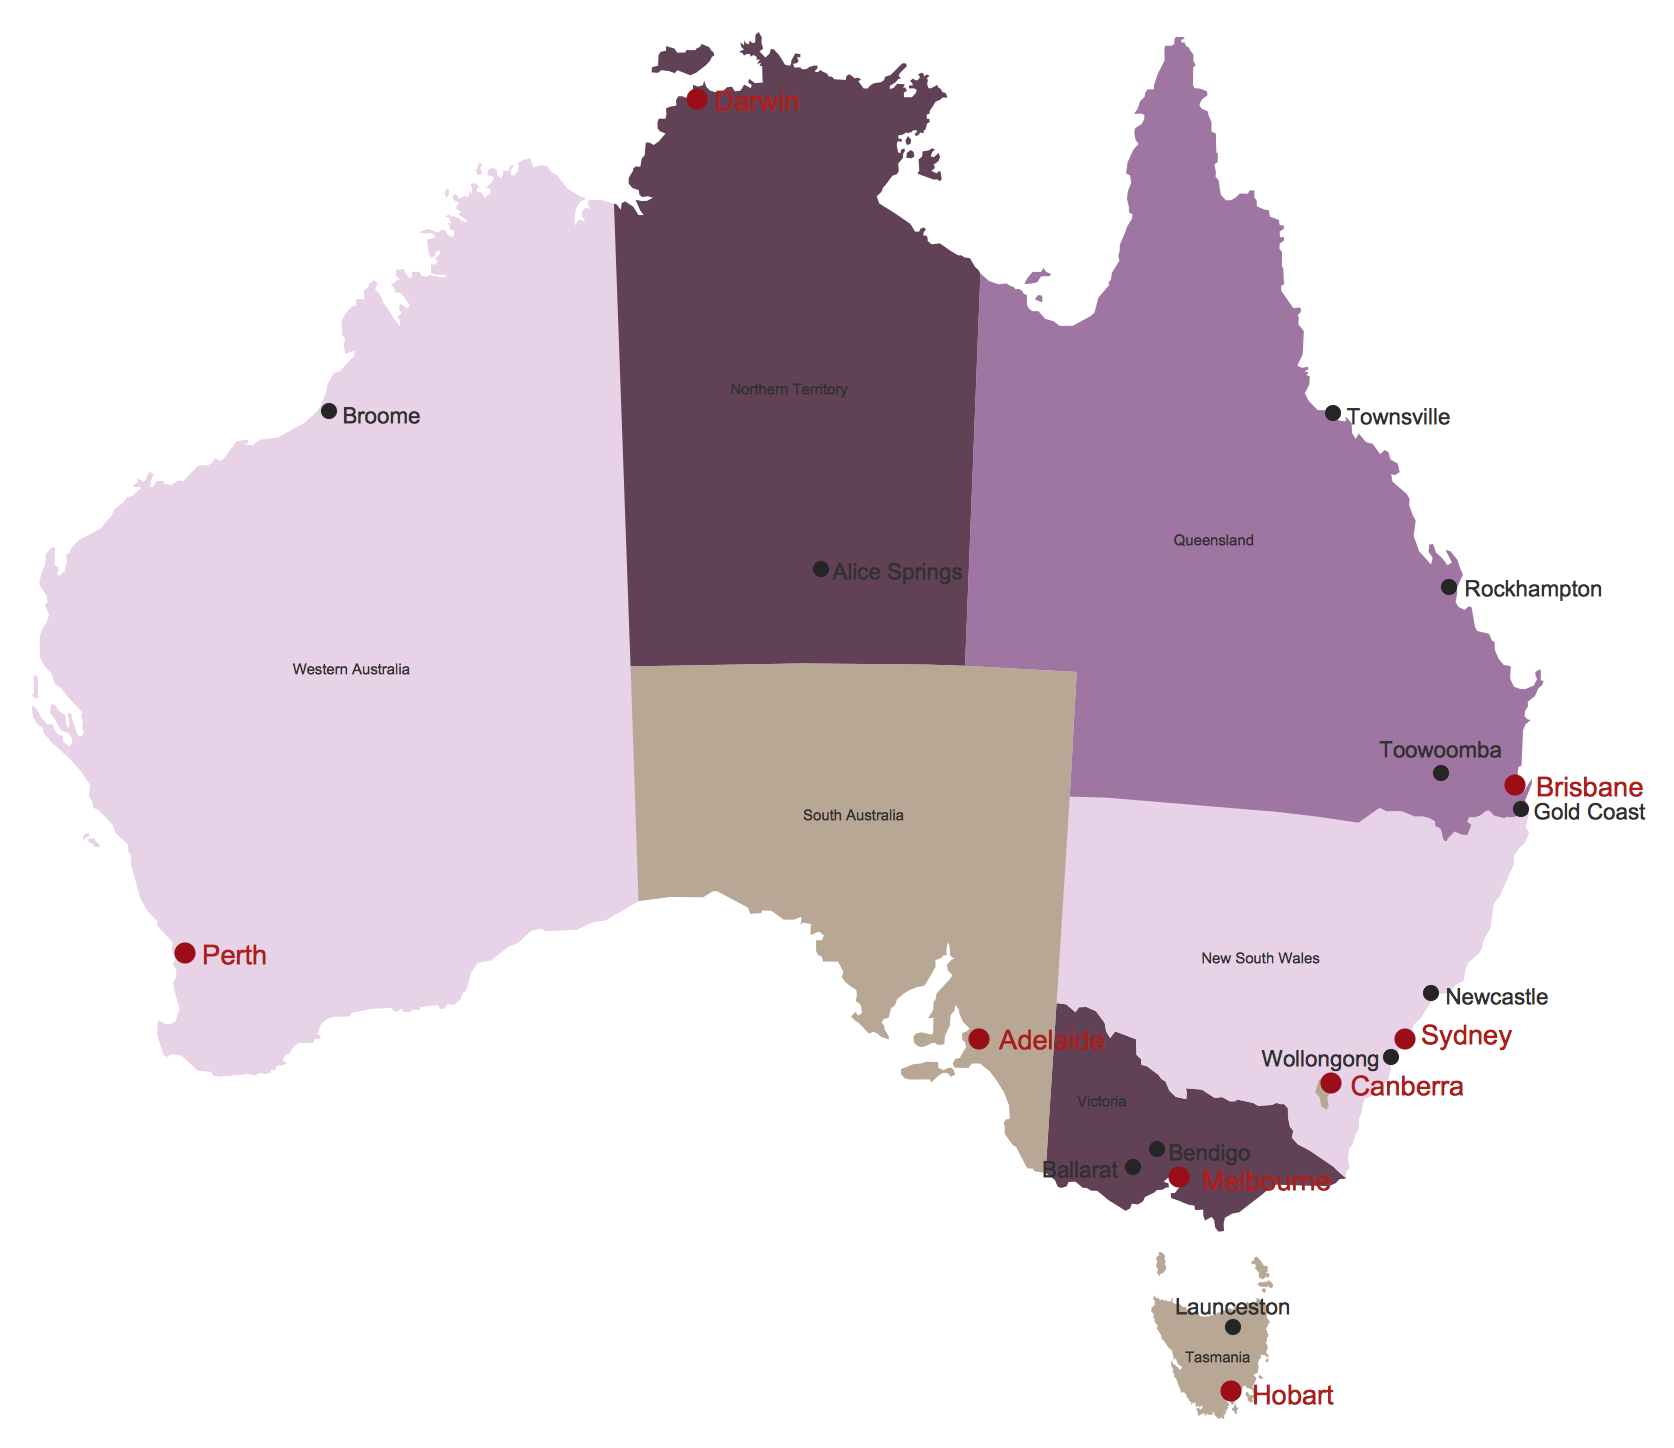
Maps surround us everywhere in our life, study, work, traveling, they are widely used in geography, history, politics, economics, and many other fields of science and life activity. But designing of maps is usually complex and labor-intensive process. Now we have the possibility to make easier this process - ConceptDraw PRO diagramming and vector drawing software extended with Australia Map Solution from the Maps Area of ConceptDraw Solution Park will help us in easy drawing detailed Australia map.Best Tool for Infographic Construction
ConceptDraw is a best data visualization tool that will allow everyone to create rich infographics and visualizations quickly and easily.Sales Process Map
You need create a Sales Process Map? Use the ConceptDraw PRO software which is ideal for the sales process management, marketing and engineering thanks to the powerful Sales Flowcharts solution from the Marketing area of ConceptDraw Solution Park.Tools to Create Your Own Infographics
Over the past few centuries, data visualization has evolved so much that we use it every day in all areas of our lives. Many believe that infographic is an effective tool of storytelling, as well as analytics, and that it is able to overcome most of the language and educational barriers. Understanding the mechanisms of human perception will help you to understand how abstract forms and colors used in data visualization can transmit information more efficient than long paragraphs of text.Bar Diagrams for Problem Solving. Create economics and financial bar charts with Bar Graphs Solution
Create bar graphs for visualizing economics problem solving and financial data comparison using the ConceptDraw PRO diagramming and vector drawing software extended with the Bar Graphs Solution from the Graphs and Charts area of ConceptDraw Solition Park.Map Infographic Creator
Follow samples and map templates to create nfographic maps. It's super-easy!How to Create a Scatter Chart
Simple tutorial help you learn how to draw a scatter chart and increase you possibilities of understanding and work more effective with our scatter chart software.Informative and Well-Designed Infographics
Informative and well-designed Infographics allows visually present various map containing information.- World Continents Map | Business Process Flowchart Symbols ...
- Seven Continents And The Diagram
- Continent Maps | World Continents Map | Geo Map - South America ...
- Picture Graph | How to Draw a Line Graph | Continent Maps | How ...
- World Continents Map | Map of Continents | Geo Map - World | Draw ...
- World Map Flow Chart Creator
- 7 Continents Map | Continent Maps | Informative and Well-Designed ...
- 7 Continents Map | Map of Continents | World Continents Map ...
- How To Make A Bargraph Of Area Of World Continents
- Draw Clearly With Diagram The Continent Of The World
- Continent Maps
- Continent Maps | World Continents Map | Map of Continents | Shape ...
- How to Draw a Map of North America Using ConceptDraw PRO ...
- 7 Continents Map | World Continents Map | Map of Continents | 7 ...
- Map of Continents | Map of USA | Timeline Diagrams | Flow Chart ...
- Process Flowchart | Geo Mapping Software Examples - World Map ...
- World Continents Map | 7 Continents Map | Map of Continents ...
- Line Chart Examples | Population growth by continent | San ...
- Basic Divided Bar Diagrams | How to Draw Pictorial Chart . How to ...
- World Continents Map
