How can you illustrate the weather condition

Chore charts with ConceptDraw DIAGRAM

Best Diagramming Software for macOS


Beautiful Nature Scene: Drawing
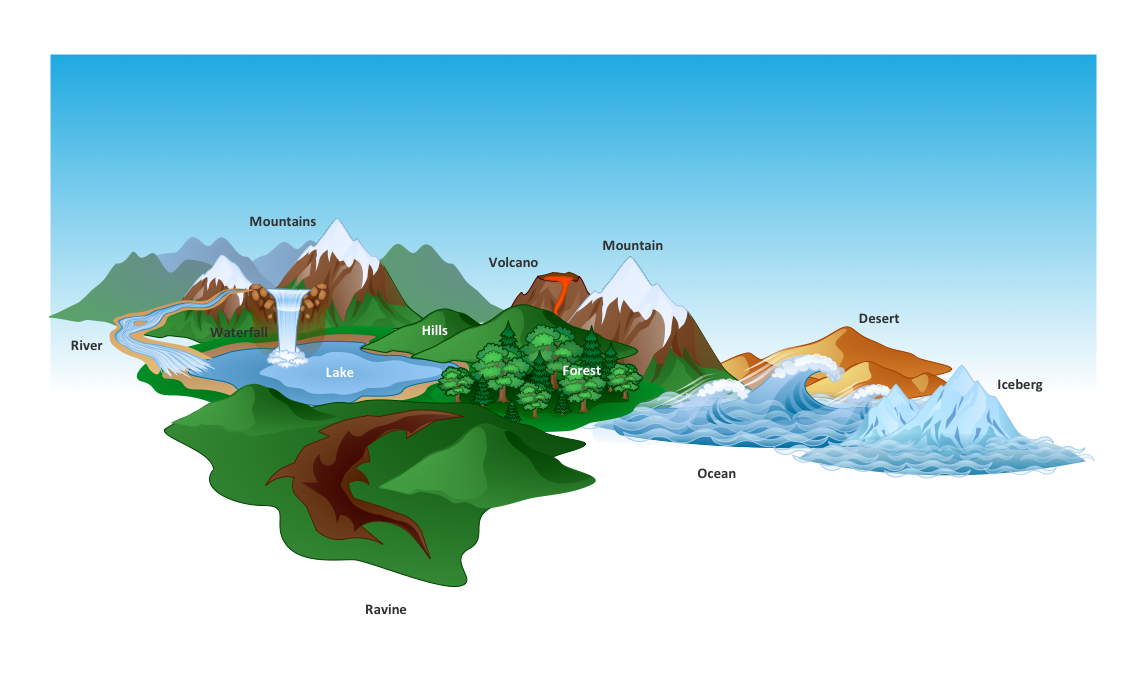
Drawing Illustration

How to Create Flowcharts for an Accounting Information System

 AWS Architecture Diagrams
AWS Architecture Diagrams with powerful drawing tools and numerous predesigned Amazon icons and AWS simple icons is the best for creation the AWS Architecture Diagrams, describing the use of Amazon Web Services or Amazon Cloud Services, their application for development and implementation the systems running on the AWS infrastructure. The multifarious samples give you the good understanding of AWS platform, its structure, services, resources and features, wide opportunities, advantages and benefits from their use; solution’s templates are essential and helpful when designing, description and implementing the AWS infrastructure-based systems. Use them in technical documentation, advertising and marketing materials, in specifications, presentation slides, whitepapers, datasheets, posters, etc.
Comparing ConceptDraw DIAGRAM to Omnigraffle

 Directional Maps
Directional Maps solution extends ConceptDraw DIAGRAM software with templates, samples and libraries of vector stencils for drawing the directional, location, site, transit, road and route maps, plans and schemes.
 Calendars
Calendars solution extends ConceptDraw DIAGRAM software with templates, samples and library of vector stencils for drawing the business calendars and schedules.
 Plant Layout Plans
Plant Layout Plans solution can be used for power plant design and plant layout design, for making the needed building plant plans and plant layouts looking professionally good. Having the newest plant layout software, the plant design solutions and in particular the ConceptDraw’s Plant Layout Plans solution, including the pre-made templates, examples of the plant layout plans, and the stencil libraries with the design elements, the architects, electricians, interior designers, builders, telecommunications managers, plant design engineers, and other technicians can use them to create the professionally looking drawings within only a few minutes.
 Block Diagrams
Block diagrams solution extends ConceptDraw DIAGRAM software with templates, samples and libraries of vector stencils for drawing the block diagrams.
 Fire and Emergency Plans
It's a good idea to have an emergency exit strategy in place for your home or business. ConceptDraw gives you the tools to create your own fire and emergency plan, tailored to your setting.
HelpDesk
How To Create an Involvement Matrix

- Beautiful Nature Scene: Drawing | Nature Drawings - How to Draw ...
- Beautiful Nature Scene: Drawing | Nature Drawings - How to Draw ...
- Astronomy Pictures | How to Draw a Natural Landscape | Landscape ...
- How To Draw A Easy Geography Picture
- Beautiful Nature Scene: Drawing | Nature Drawings - How to Draw ...
- How to Draw a Natural Landscape | Chore charts with ConceptDraw ...
- Beautiful Pictures To Draw On Chart
- Drawing Illustration | How to Draw a Natural Landscape | Basic ...
- Nature Pics To Draw On A Chart
- Some Beautiful Images For Chart Drawing
- Nature Scene To Draw In Chart
- How To Process Drawing Nature Picture
- Beautiful Nature Scene: Drawing | Nature Drawings - How to Draw ...
- Beautiful Nature Scene: Drawing | Nature Drawings - How to Draw ...
- Beautiful Nature Scene: Drawing | Basic Diagramming | Drawing ...
- Pictures of Vegetables | F&B | Food Images | Image A Beautiful Seen ...
- Drawing a Nature Scene | Beautiful Nature Scene: Drawing ...
- How to Draw a Natural Landscape | Nature Drawings - How to Draw ...
- Beautiful Pictures Of Nature To Draw
- Drawing a Nature Scene | Drawing Illustration | Nature | Water ...