UML Diagram Types List

UML Diagrams with ConceptDraw DIAGRAM

UML Notation

Jacobson Use Cases Diagram

 PM Personal Time Management
PM Personal Time Management solution extends the ConceptDraw Solution Park and all ConceptDraw Office suite products providing every project participant with tools and features allowing tracking timeframe, workspace and role in a project with the aid of Microreports, calendars, and project To-Do lists. PM Personal Time Management solution makes the collaborative work easier and improves personal performance, now each project participant stays informed about the task lists, calendars and future tasks for itself and its colleagues. Be effective in project management and personal time management, generate easily your personal To-Do lists, personal calendars, personal assignment lists, project checklists, and communicate with your colleagues using e-mail and sending project Microreports via e-mail with one click.
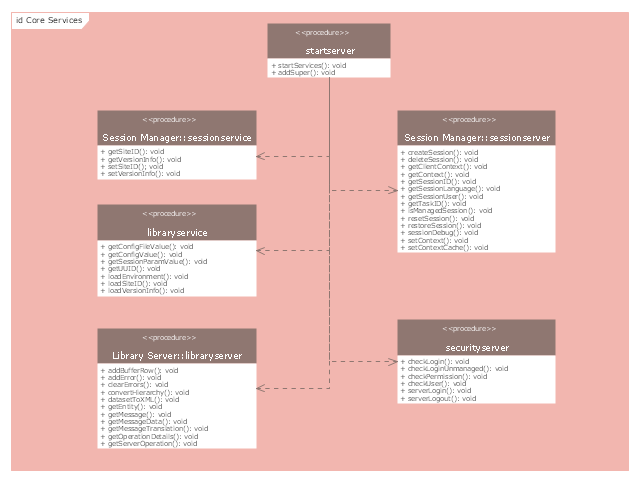
"A server is a system (software and suitable computer hardware) that responds to requests across a computer network to provide, or help to provide, a network service. Servers can be run on a dedicated computer, which is also often referred to as "the server", but many networked computers are capable of hosting servers. In many cases, a computer can provide several services and have several servers running.
Servers operate within a client-server architecture. Servers are computer programs running to serve the requests of other programs, the clients. Thus, the server performs some tasks on behalf of clients. The clients typically connect to the server through the network but may run on the same computer. In the context of Internet Protocol (IP) networking, a server is a program that operates as a socket listener.
Servers often provide essential services across a network, either to private users inside a large organization or to public users via the Internet. Typical computing servers are database server, file server, mail server, print server, web server, gaming server, application server, or some other kind of server.
Numerous systems use this client / server networking model including Web sites and email services. An alternative model, peer-to-peer networking enables all computers to act as either a server or client as needed." [Server (computing). Wikipedia]
The UML component diagram example "Start server" was created using the ConceptDraw PRO diagramming and vector drawing software extended with the Rapid UML solution from the Software Development area of ConceptDraw Solution Park.
UML component diagram
HelpDesk
How to Draw a Gantt Chart

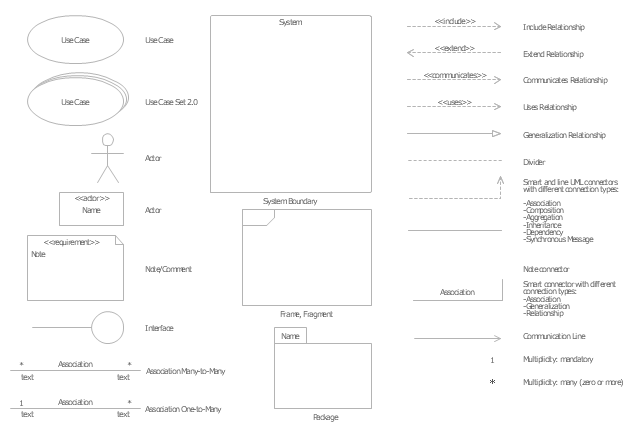
The vector stencils library "UML use case diagrams" contains 25 symbols for the ConceptDraw PRO diagramming and vector drawing software.
"Use case diagrams are usually referred to as behavior diagrams used to describe a set of actions (use cases) that some system or systems (subject) should or can perform in collaboration with one or more external users of the system (actors). Each use case should provide some observable and valuable result to the actors or other stakeholders of the system. ...
Use case diagrams are in fact twofold - they are both behavior diagrams, because they describe behavior of the system, and they are also structure diagrams - as a special case of class diagrams where classifiers are restricted to be either actors or use cases related to each other with associations. ...
Use case is usually shown as an ellipse containing the name of the use case. ...
Name of the use case could also be placed below the ellipse. ...
If a subject (or system boundary) is displayed, the use case ellipse is visually located inside the system boundary rectangle. Note, that this does not necessarily mean that the subject classifier owns the contained use cases, but merely that the use case applies to that classifier. ...
A list of use case properties - operations and attributes - could be shown in a compartment within the use case oval below the use case name. ...
Use case with extension points may be listed in a compartment of the use case with the heading extension points. ...
A use case can also be shown using the standard rectangle notation for classifiers with an ellipse icon in the upper right-hand corner of the rectangle and with optional separate list compartments for its features. ...
Subject (sometimes called a system boundary) is presented by a rectangle with subject's name, associated keywords and stereotypes in the upper left corner. Use cases applicable to the subject are located inside the rectangle and actors - outside of the system boundary. ...
Standard UML notation for actor is "stick man" icon with the name of the actor above or below of the icon. Actor names should follow the capitalization and punctuation guidelines for classes. The names of abstract actors should be shown in italics. ...
Custom icons that convey the kind of actor may also be used to denote an actor, such as using a separate icon(s) for non-human actors. ...
An actor may also be shown as a class rectangle with the standard keyword «actor», having usual notation for class compartments ...
An actor can only have binary associations to use cases, components, and classes. ...
An association between an actor and a use case indicates that the actor and the use case somehow interact or communicate with each other.
Only binary associations are allowed between actors and use cases.
An actor could be associated to one or several use cases. ...
A use case may have one or several associated actors." [uml-diagrams.org/ use-case-diagrams.html]
The example "Design elements - UML use case diagrams" is included in the Rapid UML solution from the Software Development area of ConceptDraw Solution Park.
UML use case diagram symbols
 PM Easy
PM Easy solution extends the ConceptDraw PROJECT functionality with an ability to support neutral methodology of project management and to quickly start a project by listing the task relationships and dependencies, that makes the iterative planning much easier. The project management tool and available visual tools, such as mind mapping, increase the effectiveness of tracking and analysis your project tasks. PM Easy solution from ConceptDraw Solution Park is mainly targeted at project managers in small or medium-sized companies, allowing them to make the project plan and execute projects using mind mapping technique, to implement planning using mind mapping, and to track tasks using ConceptDraw PROJECT application.
Software development with ConceptDraw products

 Entity-Relationship Diagram (ERD)
Entity-Relationship Diagram (ERD) solution extends ConceptDraw DIAGRAM software with templates, samples and libraries of vector stencils from drawing the ER-diagrams by Chen's and crow’s foot notations.
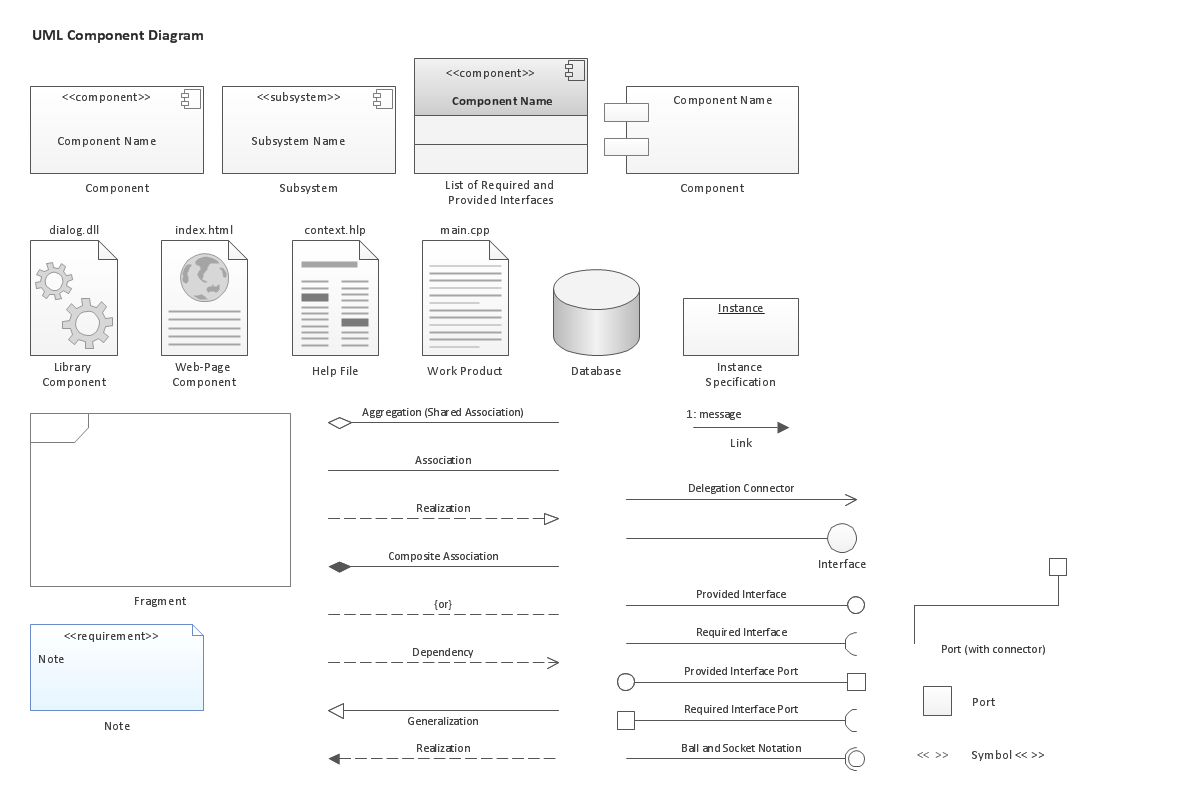
UML Component Diagram. Design Elements

 ConceptDraw Solution Park
ConceptDraw Solution Park collects graphic extensions, examples and learning materials
HelpDesk
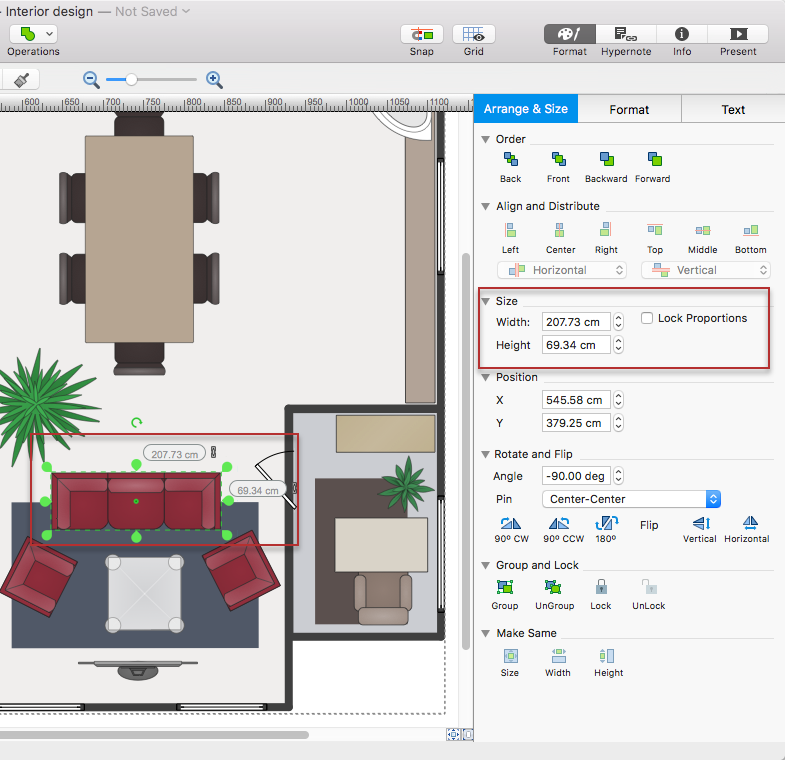
How to Change the Measurement Units and Drawing Scale
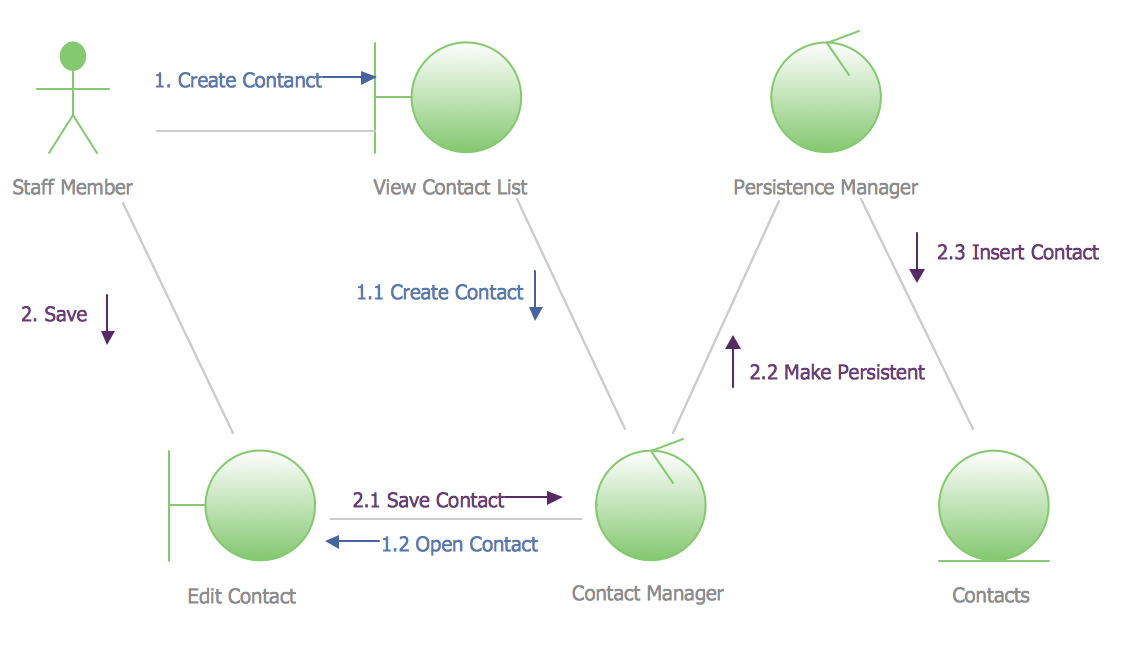
UML Collaboration Diagram Example Illustration
HelpDesk
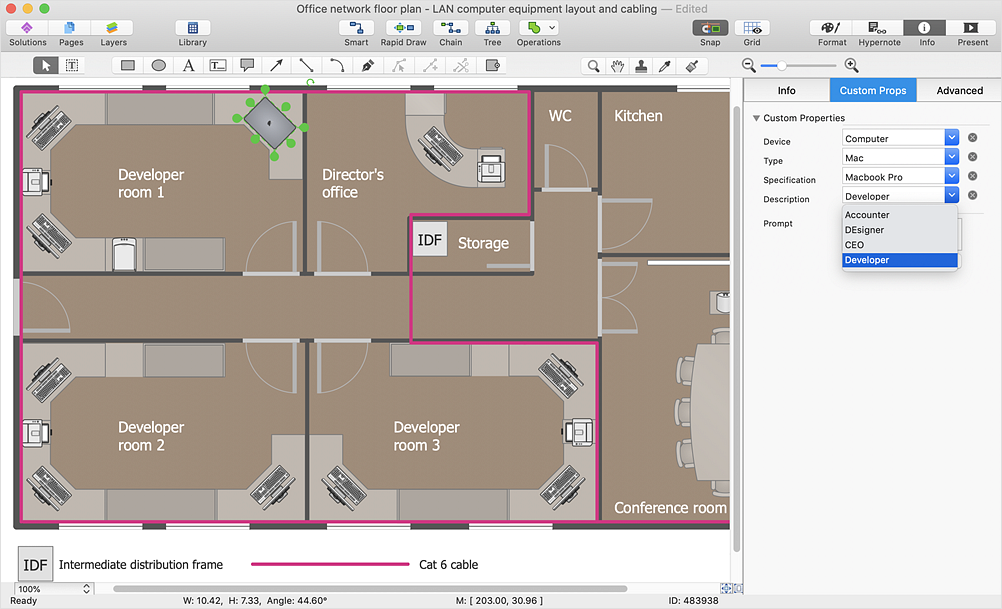
How to Work with Custom Properties
- UML Diagrams with ConceptDraw PRO | UML Diagram Types List ...
- UML Diagram Types List | UML Notation | UML Diagrams with ...
- UML Diagram Types List | UML Diagram Types | UML Diagrams with
- UML Diagram Types List
- UML Diagram Types List | UML Diagrams with ConceptDraw PRO ...
- UML Diagram Types List | 5 Level pyramid model diagram ...
- UML Diagram | UML Diagram Types List | UML for Software ...
- UML Notation | UML Diagram Types List | Software and Database ...
- UML Diagram | UML Diagram Types List | Rapid UML | Uml Diagram
- UML Use Case Diagram Example Social Networking Sites Project ...
- UML Diagram Types List | UML Component Diagram | UML Software
- UML Diagram | UML Diagram Types List | UML Business Process ...
- UML Diagram Types List | Program Evaluation and Review ...
- UML Diagram | UML Diagram Types List | Design elements - UML ...
- Computer Networking Tools List | Basic Flowchart Symbols and ...
- UML Diagram Types List | UML Diagram | UML Notation | Software ...
- UML Diagram | UML Diagram Types List | ATM UML Diagrams ...
- UML Diagram Types List | UML Block Diagram | UML Diagram ...
- UML Notation | UML Diagram Types List | UML Diagramming ...
- UML Diagram Types List | UML Diagram | UML Notation | Describe ...