 Line Graphs
How to draw a Line Graph with ease? The Line Graphs solution extends the capabilities of ConceptDraw PRO v10 with professionally designed templates, samples, and a library of vector stencils for drawing perfect Line Graphs.
How to Draw a Line Graph

Line Graph Charting Software

Line Chart Template for Word

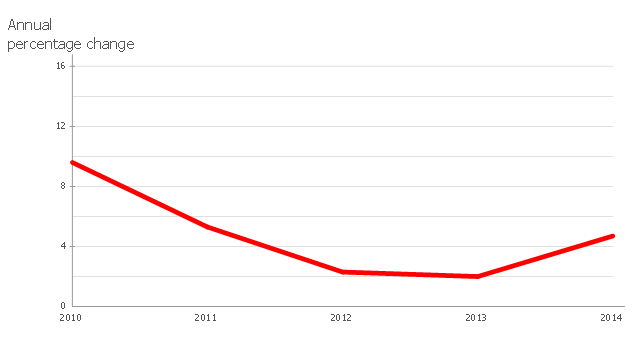
The line graph example "France exports of goods and services" depicts data from the European Economic Forecast (EUROPEAN ECONOMY 1|2013, Economic and Financial Affairs Winter 2013, European Commission)
[ec.europa.eu/ economy_ finance/ publications/ european_ economy/ 2013/ pdf/ ee1_ en.pdf].
"Exports in France decreased to 36526 EUR Million in October of 2013 from 36637 EUR Million in September of 2013. Exports in France is reported by the Ministère de l'Économie et des Finances. Exports in France averaged 17102.29 EUR Million from 1970 until 2013, reaching an all time high of 37964 EUR Million in August of 2012 and a record low of 1165.60 EUR Million in May of 1970. France is one of the largest exporters of luxury goods and agricultural products in the world. France main exports are: aircrafts (10.1 percent of total exports), food (9.7 percent), chemicals (9.5 percent), industrial machinery (8.3 percent), iron and steel (7.9 percent), electronics (6.7 percent), motor vehicles (6.3 percent) and pharmaceuticals (6.1 percent). Trade outflows to Europe account for 70 percent of total exports. Main export partners are: Germany (16.6 percent of total exports), Italy (8.2 percent), Spain (7.3 percent), Belgium (7.2 percent), the United Kingdom (6.6 percent), the United States (5.6 percent), Netherlands and China. This page contains - France Exports - actual values, historical data, forecast, chart, statistics, economic calendar and news." [tradingeconomics.com/ france/ exports]
The line graph example "France exports of goods and services" was created using ConceptDraw PRO diagramming and vector drawing software extended with Line Graphs solution from Graphs and Charts area of ConceptDraw Solution Park.
Line chart
What Is a Line Chart

Chart Maker for Presentations

 Picture Graphs
Typically, a Picture Graph has very broad usage. They many times used successfully in marketing, management, and manufacturing. The Picture Graphs Solution extends the capabilities of ConceptDraw PRO v10 with templates, samples, and a library of professionally developed vector stencils for designing Picture Graphs.
Line Chart Examples

 Bar Graphs
The Bar Graphs solution enhances ConceptDraw PRO v10 functionality with templates, numerous professional-looking samples, and a library of vector stencils for drawing different types of Bar Graphs, such as Simple Bar Graph, Double Bar Graph, Divided Bar Graph, Horizontal Bar Graph, Vertical Bar Graph, and Column Bar Chart.
HelpDesk
How to Draw a Line Chart Quickly

 Basic Diagramming
This solution extends ConceptDraw PRO software with the specific tools you need to easily draw flowcharts, block diagrams, histograms, pie charts, divided bar diagrams, line graphs, circular arrows diagrams, Venn diagrams, bubble diagrams and concept maps
Scatter Graph Charting Software

 ConceptDraw Solution Park
ConceptDraw Solution Park collects graphic extensions, examples and learning materials
Basic Diagramming


How to Create a Line Chart

ConceptDraw Solution Park
ConceptDraw Solution Park collects graphic extensions, examples and learning materials
Chart Software for Better Presentations

Scatter Chart Examples

 Sales Dashboard
Sales Dashboard solution extends ConceptDraw PRO software with templates, samples and library of vector stencils for drawing the visual dashboards of sale metrics and key performance indicators (KPI).
- Picture Graphs | Line Graphs | Bar Graphs | Graphs
- Create Graphs and Charts | Line Graph Charting Software ...
- Line Graphs | Line Graph Charting Software | Line graph template ...
- Line graph template | Line Graph Charting Software | Line Graphs ...
- Marketing | Line Graphs | Bar Graphs | Swot Graph
- Line Graph Charting Software | Line Chart Examples | Line graph
- Picture Graphs | Picture graph template | Line Graphs | Types Of ...
- PM Presentations | Line Graphs | Bar Graphs | Agile Project ...
- Line Graphs | Line Graph Charting Software | Line graph template ...
- Line Graphs | Line Graph Charting Software | Design elements ...
- Line Chart Examples | How to Create a Line Chart | Line chart ...
- Line graphs - Vector stencils library | Graphs and Charts Area ...
- Picture Graphs | Flowchart Example: Flow Chart of Marketing ...
- Line Graphs
- Double Bar Graph | Create Graphs and Charts | Design elements ...
- Picture Graphs | Chart Maker for Presentations | Line Graphs ...
- Basic Diagramming | Picture Graphs | Create Graphs and Charts ...
- Design elements - Line graphs | Line Chart Examples | Scatter Chart ...
- Picture graph template | Line graph template | Product life cycle ...
- Basic Diagramming | Line Chart Template for Word | Line Graph ...