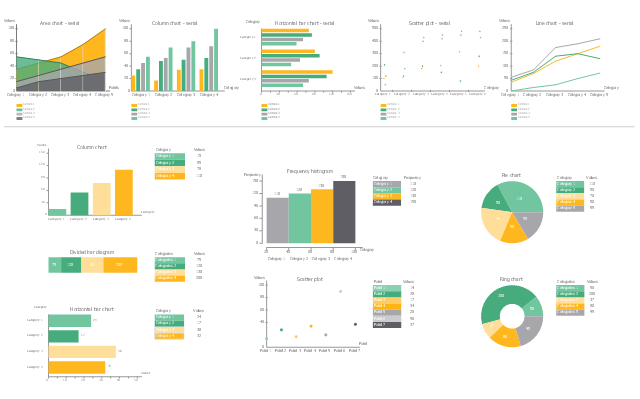
The vector stencils library "Financial charts" contains 12 charts and graphs.
"A chart, also called a graph, is a graphical representation of data, in which the data is represented by symbols, such as bars in a bar chart, lines in a line chart, or slices in a pie chart". A chart can represent tabular numeric data, functions or some kinds of qualitative structure and provides different info." [Chart. Wikipedia]
Use it to design your financial infographics.
Infographic elements
Financial Comparison Chart

Bar Chart Template for Word

Bar Diagrams for Problem Solving. Create economics and financial bar charts with Bar Graphs Solution

 Business Diagrams Package
Business Diagrams Package is a large set of comprehensive graphical solutions from the ConceptDraw Solution Park, which are powerful in solving the business, marketing and quality tasks in completely different fields, such as finance, education, health food and cooking, HR, and many others. The tools of this package's solutions are a powerful assistant in drawing all diversity of Financial and Marketing infographics, Business process workflow diagrams, Organizational charts, Education infographics, Quality diagrams, Health food diagrams, HR flowcharts, as well as different graphics and charts, which depict the values of key business indicators, their dependencies, give the full understanding of a situation within a company and on the market.
Sales Growth. Bar Graphs Example

Scatter Chart Analysis. Scatter Chart Example
This line chart sample depicts data from the European Economic Forecast (EUROPEAN ECONOMY 1|2013, Economic and Financial Affairs Winter 2013, European Commission).
[ec.europa.eu/ economy_ finance/ publications/ european_ economy/ 2013/ pdf/ ee1_ en.pdf]
"Exports in France decreased to 36526 EUR Million in October of 2013 from 36637 EUR Million in September of 2013. Exports in France is reported by the Ministère de l'Économie et des Finances. Exports in France averaged 17102.29 EUR Million from 1970 until 2013, reaching an all time high of 37964 EUR Million in August of 2012 and a record low of 1165.60 EUR Million in May of 1970. France is one of the largest exporters of luxury goods and agricultural products in the world. France main exports are: aircrafts (10.1 percent of total exports), food (9.7 percent), chemicals (9.5 percent), industrial machinery (8.3 percent), iron and steel (7.9 percent), electronics (6.7 percent), motor vehicles (6.3 percent) and pharmaceuticals (6.1 percent). Trade outflows to Europe account for 70 percent of total exports. Main export partners are: Germany (16.6 percent of total exports), Italy (8.2 percent), Spain (7.3 percent), Belgium (7.2 percent), the United Kingdom (6.6 percent), the United States (5.6 percent), Netherlands and China. This page contains - France Exports - actual values, historical data, forecast, chart, statistics, economic calendar and news." [tradingeconomics.com/ france/ exports]
The line graph example "France exports of goods and services" was created using ConceptDraw PRO diagramming and vector drawing software extended with Line Graphs solution from Graphs and Charts area of ConceptDraw Solution Park.
Line chart

- Financial Line Graph
- How to Draw a Line Chart Quickly | Block diagram - Selling ...
- Line Chart Examples | Line Chart Template for Word | Basic ...
- Number of airlines departures in the given years - Line chart ...
- Bar Diagrams for Problem Solving. Create economics and financial ...
- Diagrammatic Representation Of Data Line Graph Bar Diagram Pie
- Design elements - Financial charts | Finance Chart Image Png
- Bar Diagrams for Problem Solving. Create economics and financial ...
- Sales Growth. Bar Graphs Example | Business Report Pie. Pie Chart ...
- Line Chart Examples | Line Chart Template for Word | How to Draw ...