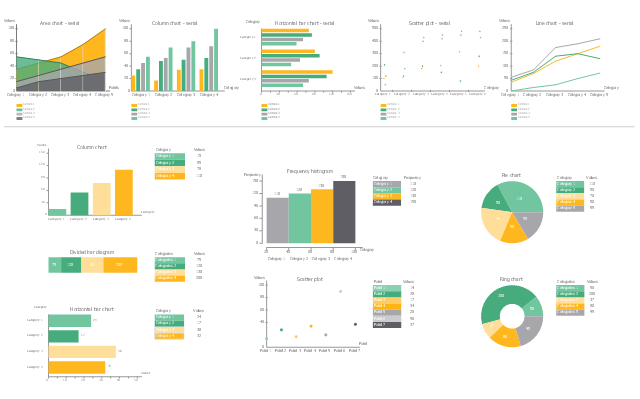
The vector stencils library "Financial charts" contains 12 charts and graphs.
"A chart, also called a graph, is a graphical representation of data, in which the data is represented by symbols, such as bars in a bar chart, lines in a line chart, or slices in a pie chart". A chart can represent tabular numeric data, functions or some kinds of qualitative structure and provides different info." [Chart. Wikipedia]
Use it to design your financial infographics.
Infographic elements
Financial Comparison Chart

Sales Growth. Bar Graphs Example

Bar Diagrams for Problem Solving. Create economics and financial bar charts with Bar Graphs Solution

Scatter Chart Examples

Bar Chart Template for Word

 Bar Graphs
The Bar Graphs solution enhances ConceptDraw PRO v10 functionality with templates, numerous professional-looking samples, and a library of vector stencils for drawing different types of Bar Graphs, such as Simple Bar Graph, Double Bar Graph, Divided Bar Graph, Horizontal Bar Graph, Vertical Bar Graph, and Column Bar Chart.
Pie Chart Word Template. Pie Chart Examples

Business Report Pie. Pie Chart Examples

- Line Chart Examples | Line Chart Template for Word | Basic ...
- Financial Comparison Chart | Bar Diagrams for Problem Solving ...
- Sales Growth. Bar Graphs Example | Business Report Pie. Pie Chart ...
- Line Chart Examples | Line Chart Template for Word | How to Draw ...
- How to Create a Timeline Diagram in ConceptDraw PRO | Project ...
- How To Draw Line Graph In Economics
- Example Of Line Graph From Economics
- Diagrammatic Representation Of Data Line Graph Bar Diagram Pie
- Example Of Line Graph With Explanation Philippines Economy