This arrow loop cycle diagram sample was created on the base of the figure illustrating the webpage "Exploratory Advanced Research Program Hand-Off Workshops" from the US Department of Transportation - Federal Highway Administration (FHWA) website. "The FHWA’s research and technology innovation life cycle illustrates that research and technology development are not insular activities, but integrated processes that together constitute a system.
Following general workshop discussion, a number of common issues emerged among the groups. These centered around the research life cycle, communicating the value of exploratory advanced research, and continued project funding. It was felt that there is a general need to better describe the research and deployment cycle specific to highway transportation and possibly to highway research fields, such as materials or system planning. Research life cycle diagrams show a very linear, chronological process but it is not necessarily that way in reality." [fhwa.dot.gov/ advancedresearch/ pubs/ 11034/ ]
The arrow loop diagram example "Innovation life cycle" was created using the ConceptDraw PRO diagramming and vector drawing software extended with the Target and Circular Diagrams solution from the Marketing area of ConceptDraw Solution Park.
www.conceptdraw.com/ solution-park/ marketing-target-and-circular-diagrams
Arrow loop cycle diagram
This arrow ring diagram sample was created on the base of the figure illustrating the webpage "Grant Life Cycle" from the Georgia College website. "Grant Life Cycle.
Define Opportunity: Funding opportunities can come from anywhere: databases, agency websites, professional publications or colleagues. GC subscribes to the database GRC. Federal grant opportunities can be found through Grants.gov.
Develop Proposal: Once an opportunity has been identified OGSP will do the following:
(1) Review the announcement for application requirements.
(2) Meet with the Principal Investigator (PI) to develop a project management plan.
(3) Work up a draft budget for PI approval.
(4) Complete the sponsor/ required forms and budget justification to be included in the application.
Submit & Negotiate: Applications can only be submitted by GC or the GC Foundation. Once internal approval has been received, designated staff in the appropriate office will submit the application on behalf of the PI and institution. If awarded, the GC or Foundation personnel will review and negotiate acceptable terms and conditions to GC, GC Fdn and/ or USG.
All of these are part of Pre-award services. ...
Award Setup: OGSP will review award documentation and assist all responsible parties with their roles and responsibilities during the grant. OGSP is available through the life of the award to provide support with any non-financial issues.
Manage Subawards: If subawards were identified at application, OGSP will issue the subaward using GC approved forms. If the need for a portion of the work to be completed by an outside entity is noted in the post-award phase, the Grants Compliance Manager will secure agency approval and then issue the subaward. OGSP will monitor the fiscal aspects of the subaward while the PI is responsible for the programmatic compliance.
Execute Project: OGSP continually monitors each grant for compliance with award terms & conditions. As legal representative, OGSP works with the PI and funder to expedite reports and resolve any issues that might arise.
Close Out Project: Once a grant has reached the end of the project period, all funders have requirements for final progress and financial reports. OGSP will work with the PI to make sure the progress report is submitted in a timely fashion and the Business & Finance completes the final invoices or report. The storage of the official project file is the responsibility of OGSP. All information and reports should be copied to the Grant Compliance Manager for inclusion in the official record." [gcsu.edu/ grants/ grantlifecycle.htm]
The arrow ring diagram example "Grant life cycle" was created using the ConceptDraw PRO diagramming and vector drawing software extended with the Target and Circular Diagrams solution from the Marketing area of ConceptDraw Solution Park.
www.conceptdraw.com/ solution-park/ marketing-target-and-circular-diagrams
Arrow ring diagram
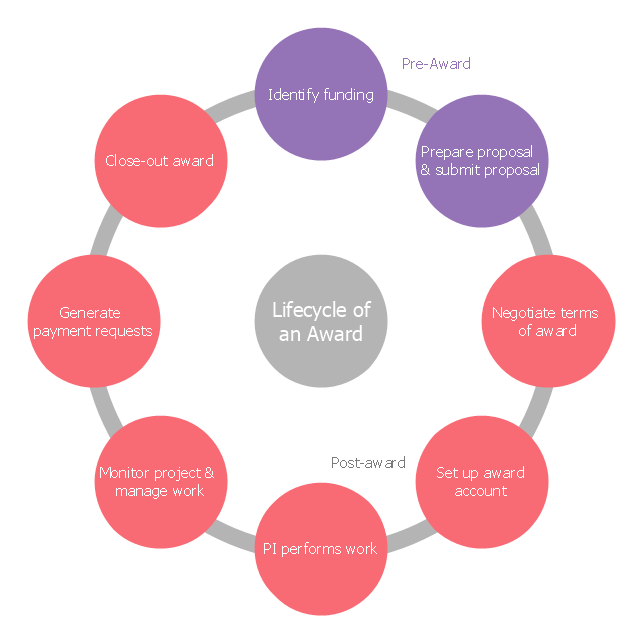
This circle diagram sample was created on the base of figure illustrating the webpage "Post-Award Process" from the Ball State University website.
[cms.bsu.edu/ about/ administrativeoffices/ contractsgrants/ postaward]
The circle diagram depicts stages of the lifecycle of an award:
(1) Identify funding.
(2) Prepare and submit proposal.
(3) Negotiate terms of award.
(4) Set up award account.
(5) PI performs work.
(6) Monitor project and manage work.
(7) Generate payment requests.
(8) Close-out award.
The circle diagram example "Lifecycle of an award" was created using the ConceptDraw PRO diagramming and vector drawing software extended with the Target and Circular Diagrams solution from the Marketing area of ConceptDraw Solution Park.
www.conceptdraw.com/ solution-park/ marketing-target-and-circular-diagrams
Circle diagram
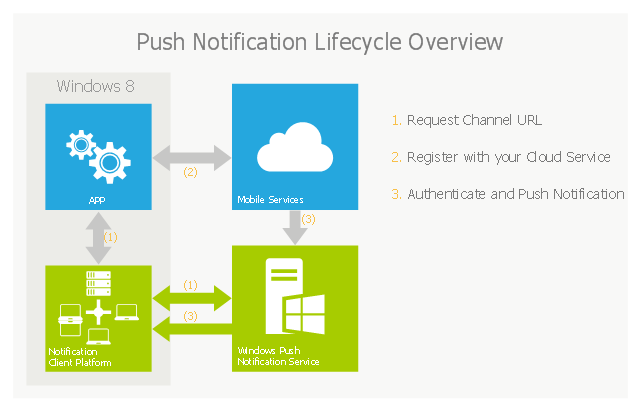
This example of cloud computing system architecture diagram was created on the base of picture in the post "Sending Windows 8 Push Notifications using Windows Azure Mobile Services" from the Nick Harris .NET blog.
"The goal of Windows Azure Mobile Services is to make it incredibly easy for developers to add a cloud backend to their client apps be it a Windows 8, Windows Phone, iOS or Android application. ... Mobile Services today provides:
- Structured Storage
- Server Logic ...
- Auth ...
- Push Notifications ...
- Common tenants of Windows Azure Services
- Scale ...
- Diagnostics ...
- Logging ...
What are Push Notifications?
The Windows Push Notification Services (WNS) enables you to send toast, tile, badge and raw notifications from the cloud to your Windows Store applications even when your app is not running. Push notifications are ideal for scenarios when you need to target a specific user with personalized content.
The following diagram depicts the general Lifecycle of a push notifications via the Windows Azure Notification Service (WNS). We’ll walk through the steps shortly but before doing so I thought it would be important to call out that as a developer implementing a push notification scenario all you need to do is implement those interactions in grey and the applications/ services in blue." [nickharris.net/ index.php/ 2012/ 10/ 04/ blog-series-sending-windows-8-push-notifications-using-windows-azure-mobile-services/ ]
The diagram example "Push Notification Lifecycle Overview" was created using ConceptDraw PRO diagramming and vector drawing software extended with the Azure Architecture solution from the Computer and Networks area of ConceptDraw Solution Park.
Cloud computing system architecture diagram
"Advanced Persistent Threat (APT) APT is a set of stealthy and continuous hacking processes often orchestrated by human targeting a specific entity. APT usually targets organizations and or nations for business or political motives. APT processes require high degree of covertness over a long period of time. As the name implies, APT consists of three major components/ processes: advanced, persistent, and threat. The advanced process signifies sophisticated techniques using malware to exploit vulnerabilities in systems. The persistent process suggests that an external command and control is continuously monitoring and extracting data off a specific target. The threat process indicates human involvement in orchestrating the attack.
APT usually refers to a group, such as a government, with both the capability and the intent to persistently and effectively target a specific entity. The term is commonly used to refer to cyber threats, in particular that of Internet-enabled espionage using a variety of intelligence gathering techniques to access sensitive information, but applies equally to other threats such as that of traditional espionage or attack. Other recognized attack vectors include infected media, supply chain compromise, and social engineering. Individuals, such as an individual hacker, are not usually referred to as an APT as they rarely have the resources to be both advanced and persistent even if they are intent on gaining access to, or attacking, a specific target." [Advanced persistent threat. Wikipedia]
This circular arrows diagram example was redesigned from the Wikimedia Commons file: Advanced persistent threat lifecycle.jpg.
[commons.wikimedia.org/ wiki/ File:Advanced_ persistent_ threat_ lifecycle.jpg]
This file is licensed under the Creative Commons Attribution-Share Alike 3.0 Unported license. [creativecommons.org/ licenses/ by-sa/ 3.0/ deed.en]
The example "Advanced persistent threat lifecycle" was created using the ConceptDraw PRO diagramming and vector drawing software extended with the Circular Arrows Diagrams solution from the area "What is a Diagram" of ConceptDraw Solution Park.
Circular arrows diagram

SSADM Diagram

The example below illustrates the waterfall model used in SSADM. This model involves 5 stages of developing a product such as requirements specification and its' analysis, design, coding and testing.
 Circular Arrows Diagrams
Circular Arrows Diagrams solution extends ConceptDraw PRO v10 with extensive drawing tools, predesigned samples, Circular flow diagram template for quick start, and a library of ready circular arrow vector stencils for drawing Circular Arrow Diagrams, Segmented Cycle Diagrams, and Circular Flow Diagrams. The elements in this solution help managers, analysts, business advisers, marketing experts, scientists, lecturers, and other knowledge workers in their daily work.
Draw Flowcharts with ConceptDraw

"Advanced Persistent Threat (APT) APT is a set of stealthy and continuous hacking processes often orchestrated by human targeting a specific entity. APT usually targets organizations and or nations for business or political motives. APT processes require high degree of covertness over a long period of time. As the name implies, APT consists of three major components/ processes: advanced, persistent, and threat. The advanced process signifies sophisticated techniques using malware to exploit vulnerabilities in systems. The persistent process suggests that an external command and control is continuously monitoring and extracting data off a specific target. The threat process indicates human involvement in orchestrating the attack.
APT usually refers to a group, such as a government, with both the capability and the intent to persistently and effectively target a specific entity. The term is commonly used to refer to cyber threats, in particular that of Internet-enabled espionage using a variety of intelligence gathering techniques to access sensitive information, but applies equally to other threats such as that of traditional espionage or attack. Other recognized attack vectors include infected media, supply chain compromise, and social engineering. Individuals, such as an individual hacker, are not usually referred to as an APT as they rarely have the resources to be both advanced and persistent even if they are intent on gaining access to, or attacking, a specific target." [Advanced persistent threat. Wikipedia]
This circular arrows diagram example was redesigned from the Wikimedia Commons file: Advanced persistent threat lifecycle.jpg.
[commons.wikimedia.org/ wiki/ File:Advanced_ persistent_ threat_ lifecycle.jpg]
This file is licensed under the Creative Commons Attribution-Share Alike 3.0 Unported license. [creativecommons.org/ licenses/ by-sa/ 3.0/ deed.en]
The example "Advanced persistent threat lifecycle" was created using the ConceptDraw PRO diagramming and vector drawing software extended with the Circular Arrows Diagrams solution from the area "What is a Diagram" of ConceptDraw Solution Park.
APT usually refers to a group, such as a government, with both the capability and the intent to persistently and effectively target a specific entity. The term is commonly used to refer to cyber threats, in particular that of Internet-enabled espionage using a variety of intelligence gathering techniques to access sensitive information, but applies equally to other threats such as that of traditional espionage or attack. Other recognized attack vectors include infected media, supply chain compromise, and social engineering. Individuals, such as an individual hacker, are not usually referred to as an APT as they rarely have the resources to be both advanced and persistent even if they are intent on gaining access to, or attacking, a specific target." [Advanced persistent threat. Wikipedia]
This circular arrows diagram example was redesigned from the Wikimedia Commons file: Advanced persistent threat lifecycle.jpg.
[commons.wikimedia.org/ wiki/ File:Advanced_ persistent_ threat_ lifecycle.jpg]
This file is licensed under the Creative Commons Attribution-Share Alike 3.0 Unported license. [creativecommons.org/ licenses/ by-sa/ 3.0/ deed.en]
The example "Advanced persistent threat lifecycle" was created using the ConceptDraw PRO diagramming and vector drawing software extended with the Circular Arrows Diagrams solution from the area "What is a Diagram" of ConceptDraw Solution Park.
Circular arrows diagram
The vector stencils library "Marketing diagrams" contains 9 templates of marketing and sales diagrams and charts.
Use these shapes to illustrate your marketing and sales documents, presentations, infographics and webpages in the ConceptDraw PRO diagramming and vector drawing software extended with the Marketing Diagrams solution from the Marketing area of ConceptDraw Solution Park.
www.conceptdraw.com/ solution-park/ marketing-diagrams
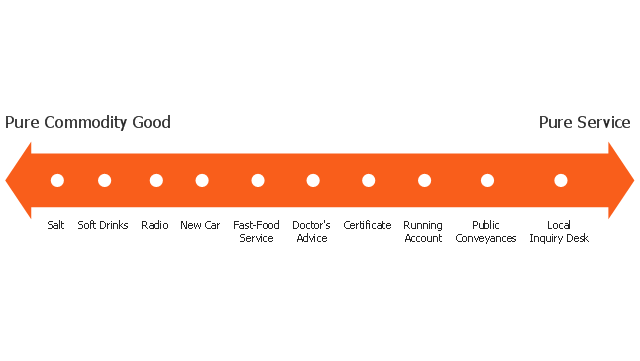
Service-goods continuum diagram
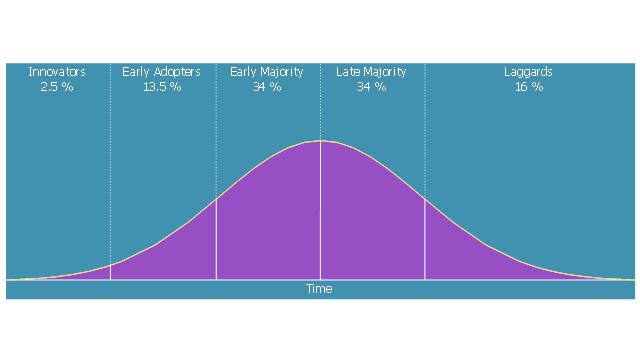
Diffusion of Innovations
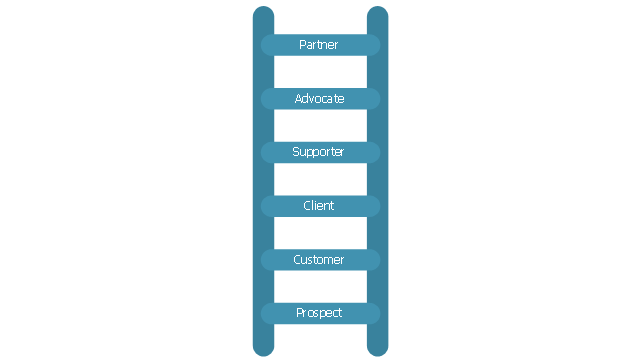
Relationship ladder of customer loyalty
Leaky bucket diagram

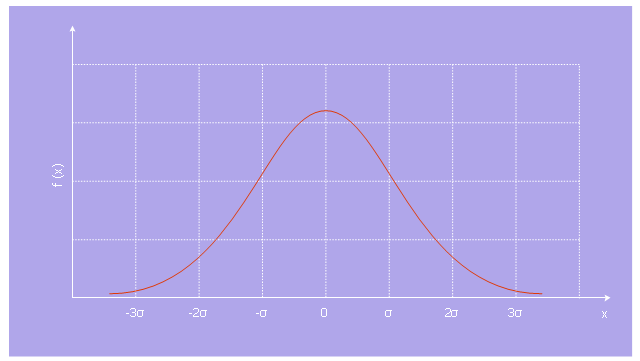
Normal distribution
Product life cycle graph
Extended product life cycle graph
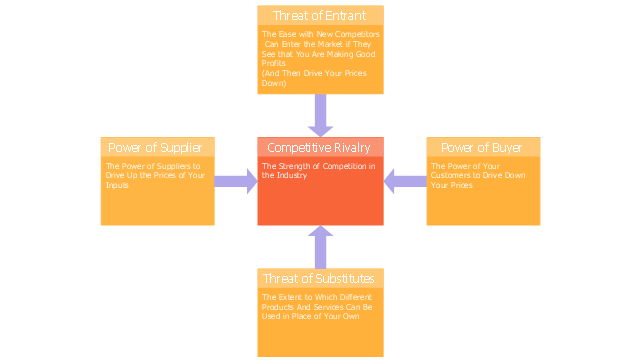
Five forces model
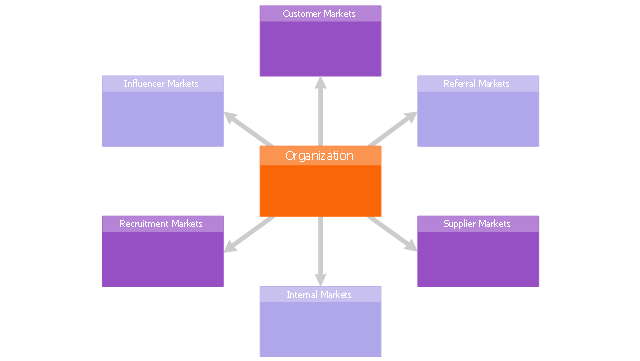
Six markets model
Step chart block
Step diagram block

Create Process Flowcharts

This example of cloud computing system architecture diagram was created on the base of picture in the post "Sending Windows 8 Push Notifications using Windows Azure Mobile Services" from the Nick Harris .NET blog.
"The goal of Windows Azure Mobile Services is to make it incredibly easy for developers to add a cloud backend to their client apps be it a Windows 8, Windows Phone, iOS or Android application. ... Mobile Services today provides:
- Structured Storage
- Server Logic ...
- Auth ...
- Push Notifications ...
- Common tenants of Windows Azure Services
- Scale ...
- Diagnostics ...
- Logging ...
What are Push Notifications?
The Windows Push Notification Services (WNS) enables you to send toast, tile, badge and raw notifications from the cloud to your Windows Store applications even when your app is not running. Push notifications are ideal for scenarios when you need to target a specific user with personalized content.
The following diagram depicts the general Lifecycle of a push notifications via the Windows Azure Notification Service (WNS). We’ll walk through the steps shortly but before doing so I thought it would be important to call out that as a developer implementing a push notification scenario all you need to do is implement those interactions in grey and the applications/ services in blue." [nickharris.net/ index.php/ 2012/ 10/ 04/ blog-series-sending-windows-8-push-notifications-using-windows-azure-mobile-services/ ]
The diagram example "Push Notification Lifecycle Overview" was created using ConceptDraw PRO diagramming and vector drawing software extended with the Azure Architecture solution from the Computer and Networks area of ConceptDraw Solution Park.
"The goal of Windows Azure Mobile Services is to make it incredibly easy for developers to add a cloud backend to their client apps be it a Windows 8, Windows Phone, iOS or Android application. ... Mobile Services today provides:
- Structured Storage
- Server Logic ...
- Auth ...
- Push Notifications ...
- Common tenants of Windows Azure Services
- Scale ...
- Diagnostics ...
- Logging ...
What are Push Notifications?
The Windows Push Notification Services (WNS) enables you to send toast, tile, badge and raw notifications from the cloud to your Windows Store applications even when your app is not running. Push notifications are ideal for scenarios when you need to target a specific user with personalized content.
The following diagram depicts the general Lifecycle of a push notifications via the Windows Azure Notification Service (WNS). We’ll walk through the steps shortly but before doing so I thought it would be important to call out that as a developer implementing a push notification scenario all you need to do is implement those interactions in grey and the applications/ services in blue." [nickharris.net/ index.php/ 2012/ 10/ 04/ blog-series-sending-windows-8-push-notifications-using-windows-azure-mobile-services/ ]
The diagram example "Push Notification Lifecycle Overview" was created using ConceptDraw PRO diagramming and vector drawing software extended with the Azure Architecture solution from the Computer and Networks area of ConceptDraw Solution Park.
Cloud computing system architecture diagram
Use the Best FlowChart Tool for the Job

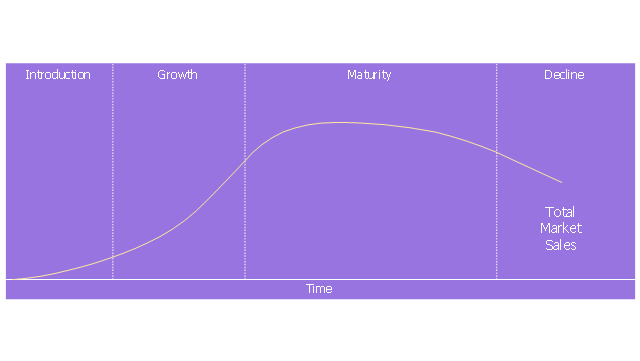
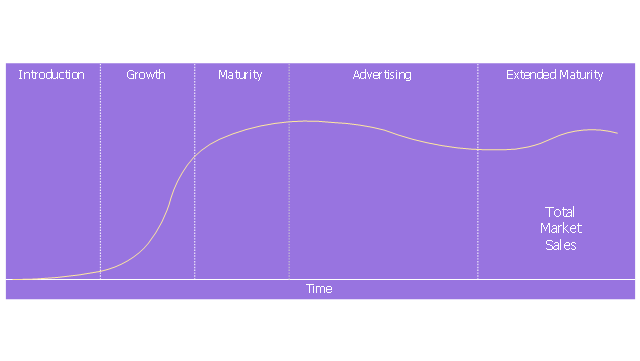
"Product life cycle is a business analysis that attempts to identify a set of common stages in the life of commercial products. In other words the 'Product Life cycle' PLC is used to map the lifespan of the product such as the stages through which a product goes during its lifespan. ...
The stages of a product's life cycle... :
1. INTRODUCTION... 2. GROWTH... 3. MATURITY... 4. DECLINE...
The product life cycle is an important concept in marketing. It includes four stages that a product goes through from when it was first thought of until it is eliminated from the industry. Not all products reach this final stage. Some continue to grow and others rise and fall." [Product lifecycle. Wikipedia]
The flow chart example "Product life cycle process" was created using the ConceptDraw PRO diagramming and vector drawing software extended with the Flowcharts solution from the area "What is a Diagram" of ConceptDraw Solution Park.
Flowchart - Product life cycle process

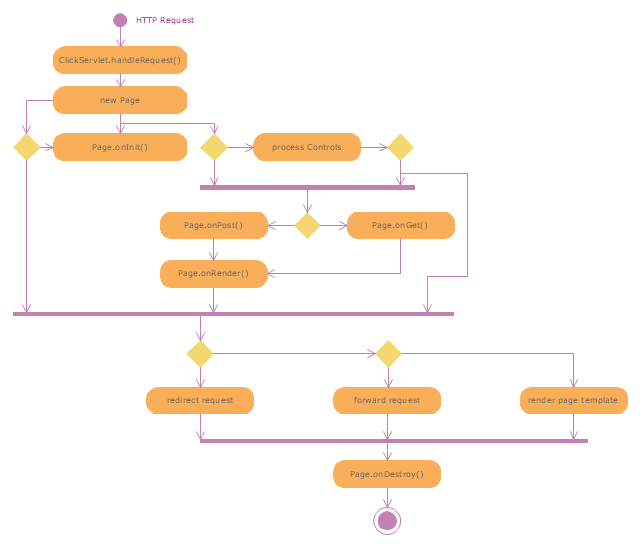
"Web container (also known as a Servlet container) is the component of a web server that interacts with Java servlets. A web container is responsible for managing the lifecycle of servlets, mapping a URL to a particular servlet and ensuring that the URL requester has the correct access rights. A web container implements the web component contract of the Java EE architecture, specifying a runtime environment for web components that includes security, concurrency, lifecycle management, transaction, deployment, and other services. A web container provides the same services as a JSP container as well as a federated view of the Java EE platform APIs." [Web container. Wikipedia]
The UML activity diagram example "Servlet container" was created using the ConceptDraw PRO diagramming and vector drawing software extended with the Rapid UML solution from the Software Development area of ConceptDraw Solution Park.
The UML activity diagram example "Servlet container" was created using the ConceptDraw PRO diagramming and vector drawing software extended with the Rapid UML solution from the Software Development area of ConceptDraw Solution Park.
UML activity diagram
- Life Cycle Diagram In Visio
- Product Life Cycle Block Diagram
- Target and Circular Diagrams | Innovation life cycle - Arrow loop ...
- Sample Lifecycle Diagram In Visio
- Draw A Diagram About Lifecycles
- Product Life Cycle Diagram
- Circular arrows diagram - BPM life cycle | Innovation life cycle ...
- Marketing Charts | Marketing diagrams - Vector stencils library ...
- Program to Make Flow Chart | BPR Diagram . Business Process ...
- Circular arrows diagram - BPM life cycle | Product life cycle process ...
- Draw And Label A Product Life Cycle Diagram
- Circular Diagram | Target Diagram | Basic Diagramming ...
- Project management life cycle - Flowchart | Basic Diagramming | PM ...
- Product life cycle process
- Marketing diagrams - Vector stencils library | Product life cycle ...
- Marketing diagrams - Vector stencils library | Marketing Diagrams ...
- Product Life Cycle Management Diagram
- Advanced persistent threat lifecycle | Creatively Draw A Diagram ...
- Product life cycle process - Flowchart
- Product life cycle graph | Marketing Diagrams