HelpDesk
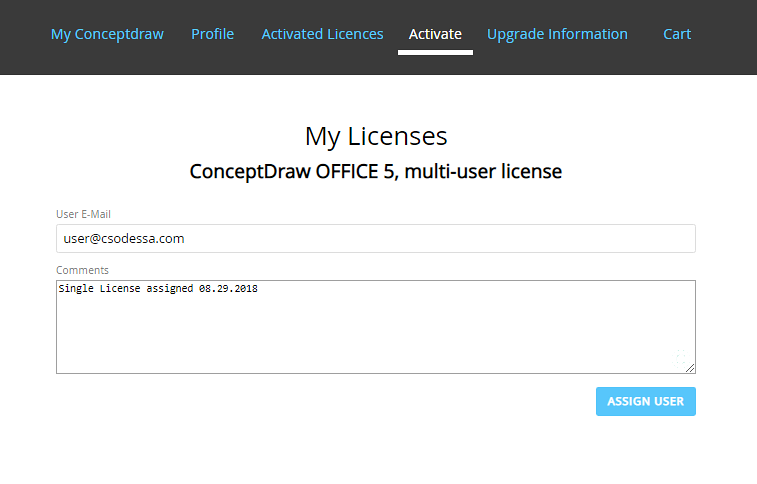
How to Manage ConceptDraw Multi - User License
Instructions on how to install and administrate ConceptDraw multi-user licenseHelpDesk
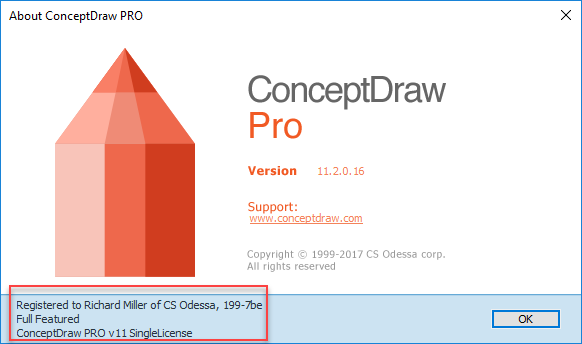
How to Use ConceptDraw Single User License
With ConceptDraw products it is possible to reassign a licensesFlow chart Example. Warehouse Flowchart
Warehouse Flowcharts are various diagrams that describe the warehousing and inventory management processes on the warehouses. Typical purposes of Warehouse Flowcharts are evaluating warehouse performance, measuring efficiency of customer service and organizational performance. This type of Workflow diagrams can be used for identifying any disconnection between business activities and business objectives. They are effectively used by warehouse-related people and organizations, manufacturers, wholesalers, exporters, importers, transporters, and others. Standard Warehousing process flow diagram and standard Workflow diagram are used for process identification for further evaluating effectiveness and profitability of overall business process. Use the ConceptDraw PRO vector graphic software extended with Flowcharts solution to design your own professional-looking Workflow diagrams and Flowcharts of any types, including the Warehouse flowchart, Process flow diagrams which depict in details all steps of Warehouse packages flow. Microsoft Visio, designed for Windows users, can’t be opened directly on Mac. But fortunately, there are several Visio alternatives for Mac which will help Mac users to work Visio files. With ConceptDraw PRO, you may open, edit and save files in Visio format.
HelpDesk
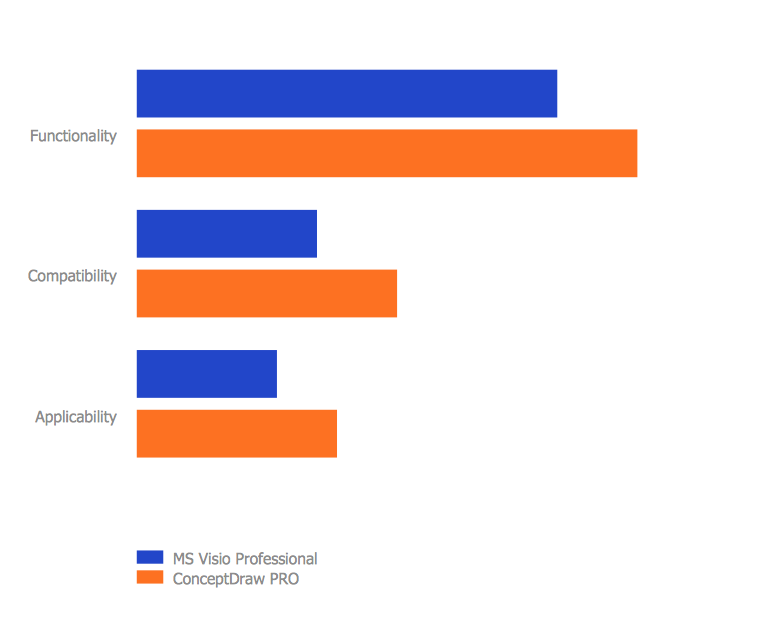
Replace Your Current Diagramming Tool
Migrate from Visio to ConceptDraw for the entire organization at super low price. By means of a ConceptDraw PRO Site License any employer in your company can get advantages of ConceptDraw PRO in just a $ 2995 per year. There is no need to count both licenses and users. Every co-worker in your organization will get permission to access at no extra charge. At half-price of Microsoft Visio®, you can supply your company with a ConceptDraw Site License. Reduced price and effortless administrating are just a couple of the causes to change Visio to ConceptDraw PRO. Here are just a few reasons.Selecting & Creating Flowcharts
ConceptDraw Flowcharts visualize a process or algorithm of program as step/operation blocks of various shapes connected with arrowed lines showed the process flow direction. They are used to visualize business or technical processes and software algorithms.Gather Requirements Exchanging Mind Maps with Evernote
Critical information from your mindmaps can be accessed from almost any device using ConceptDraw MINDMAP and Evernote.Pyramid Diagram
The Time-Money-Quality Triangle illustrates an advertising truism, that you can't have all three.Pyramid Diagram
The purchase or purchasing funnel is a consumer focused marketing model which illustrates the theoretical customer journey towards the purchase of a product or service.
 ConceptDraw Solution Park
ConceptDraw Solution Park collects graphic extensions, examples and learning materials
Sales Process Flowchart Symbols
The most easier way of creating the visually engaging and informative Sales Process Flowchart is to create the new ConceptDraw document and to use the predesigned vector symbols offered in 6 libraries of the Sales Flowchart Solution. There are more than six types of sales process flow diagrams, ConceptDraw PRO software is flowchart maker which include six collections of extended flowchart symbols for effective diagramming. There are main collections of color coded flowchart symbols: Sales Department, Sales Steps, Sales Workflow, Sales Symbols and special set of Sales Arrows and Sales Flowchart.Flowchart on Bank. Flowchart Examples
This sample was created in ConceptDraw PRO diagramming and vector drawing software using the Flowcharts solution from the Diagrams area of ConceptDraw Solution Park. This sample shows the Flowchart of the Subprime Mortgage Crisis. This Flowchart describes the decline in housing prices when the housing bubble burst and what it caused on the housing and financial markets. You can also see the Government and Industry responses in this crisis situation.
Pyramid Diagram
Triangle diagram example of DIKW pyramid has 4 levels: data, information, knowledge and wisdom.Account Flowchart Stockbridge System. Flowchart Examples
Create your own flow charts of data processing systems using the ConceptDraw PRO diagramming and vector drawing software extended with the Cross-Functional Flowcharts solution from the Business Processes area of ConceptDraw Solution Park. This is a flowchart of a data processing system combining manual and computerized processing to handle accounts receivable, billing, and general ledger.Pyramid Diagram
A triangular graphic representing Graham's "hierarchy of disagreement", based on Paul Graham's March 2008 essay "How to Disagree".Pyramid Diagram
At the base of the identity of an organisational is its organizational culture.- Use Case Diagram For Driving License Management System
- How to Manage ConceptDraw Multi - User License | Process ...
- Process Flowchart | How to Manage ConceptDraw Multi - User ...
- Flow Chart Of Policy Management
- Sales Order Flow Chart
- UML Use Case Diagram Example Registration System | Flow chart ...
- Computer Store Management System In Project Draw
- Hunting and fishing license sales flowchart | UK Map | Geo Map ...
- How to Manage ConceptDraw Multi - User License | Basic Flowchart ...
- Multi User Flow Chart
- Process Flowchart | Stakeholder Management System | Pyramid ...
- Process flow diagram - Typical oil refinery | Crude oil distillation unit ...
- Hunting and fishing license sales flowchart | Geo Map - USA - Illinois ...
- Account Flowchart. Flowchart Examples | Basic Flowchart Symbols ...
- Process Flowchart | Pyramid Diagram | ConceptDraw Arrows10 ...
- Cross-Functional Flowchart | Basic Flowchart Images. Flowchart ...
- Management Level System
- How to Manage Multiple Projects on Windows | Manage Social ...
- How to Use ConceptDraw Single User License | How to Manage ...
- Sales Process Management | Copying Service Process Flowchart ...


