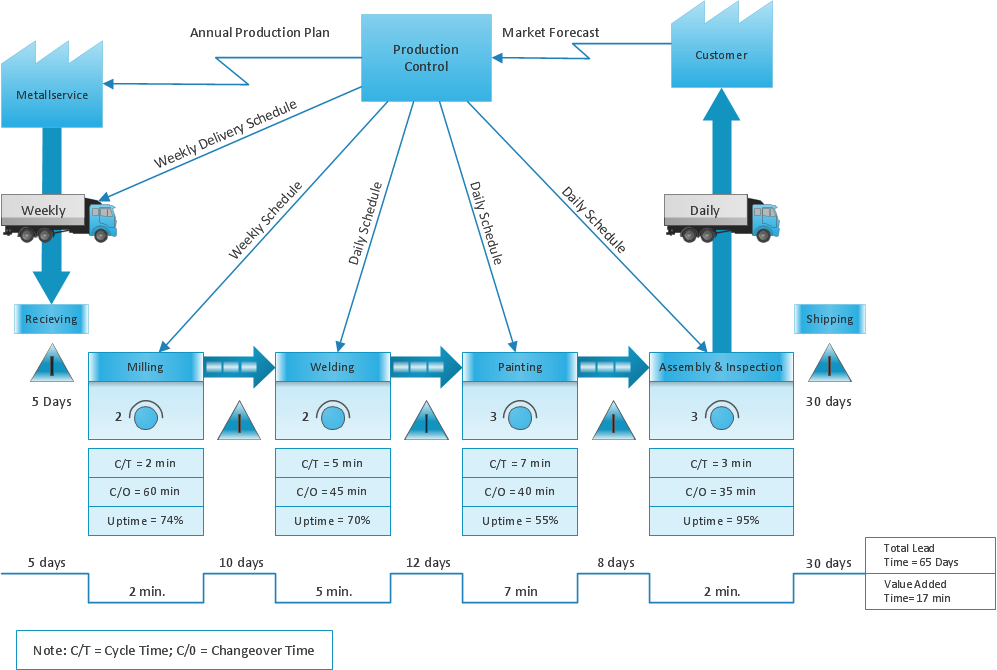
Lean Manufacturing Diagrams

Value-Stream Mapping for Manufacturing

The Lean Enterprise Value Stream Mapping
Data Flow Diagram Model

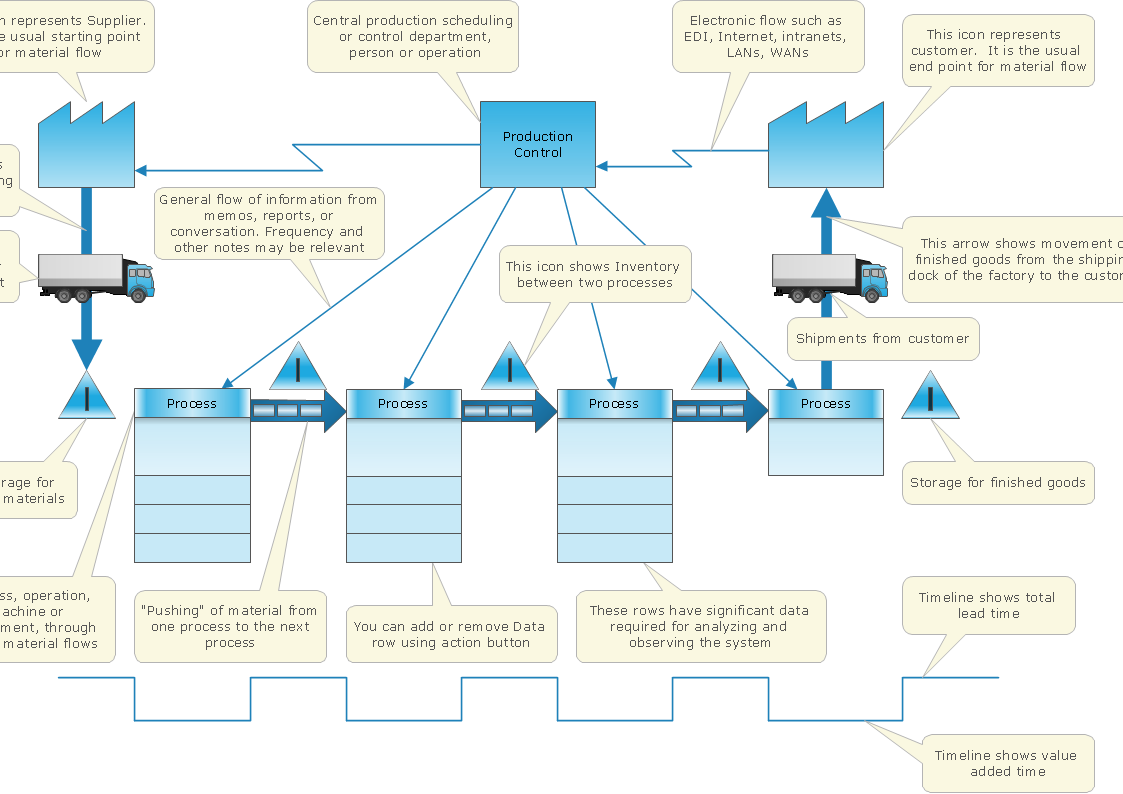
Value Stream Mapping Icons
Lean Value Stream
Lean Value Stream Map

Learn how to create a current state value stream map

Cross Functional Flowchart Examples

Lean Six Sigma Diagram Software

Value Stream Diagram

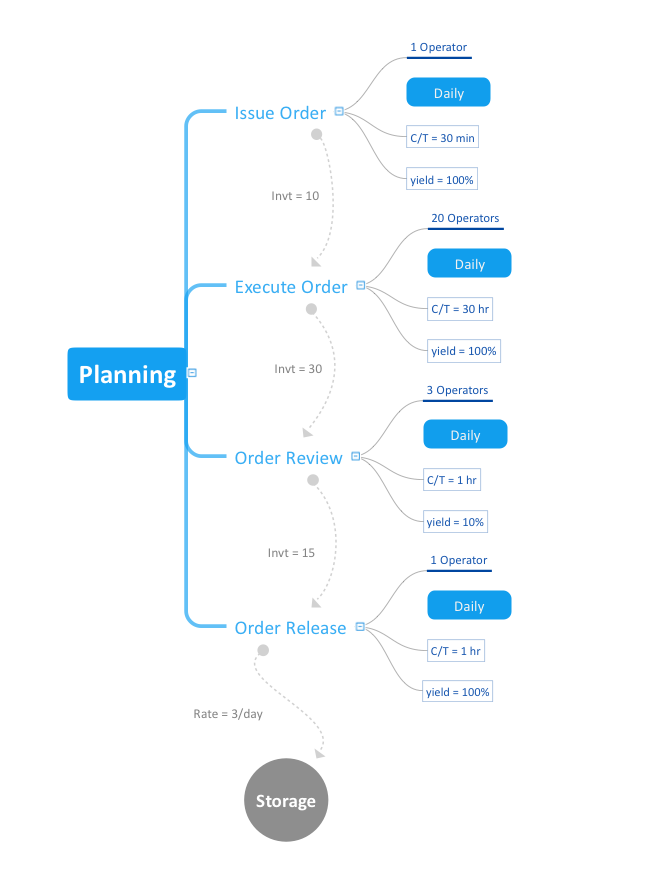
Mind Mapping in the Quality Management
 Value Stream Mapping
Value stream mapping solution extends ConceptDraw DIAGRAM software with templates, samples and vector stencils for drawing the Value Stream Maps (VSM) in lean manufacturing practice.
SIPOC Diagram

Value Stream Mapping for the Lean Office

- Lean Manufacturing Diagrams | Value-Stream Mapping for ...
- Manufacturing 8 Ms fishbone diagram - Template | Business ...
- Lean Manufacturing Diagrams | Event-driven Process Chain ...
- Lean Manufacturing Diagrams | Value Stream Mapping for the Lean ...
- Lean Manufacturing Diagrams | Lean Six Sigma Diagram Software ...
- Lean Manufacturing Diagrams | Best Value Stream Mapping mac ...
- Value stream with ConceptDraw PRO | Lean Manufacturing ...
- Lean Manufacturing Diagrams | Value-Stream Mapping for ...
- Value Stream Mapping for the Lean Office | Lean Manufacturing ...
- Value Stream Mapping | Value Stream Diagram | Lean ...
- Lean Manufacturing Diagrams | TQM Diagram Example | Types of ...
- Lean Manufacturing Diagrams | Manufacturing 8 Ms fishbone ...
- Lean Manufacturing Diagrams | Lean Value Stream | Value-Stream ...
- Lean Manufacturing Diagrams | Lean Value Stream Map | Lean ...
- Lean Manufacturing Diagrams | Lean Value Stream | Value Stream ...
- Process Flowchart | Cross Functional Flowchart Examples | Lean ...
- Definition TQM Diagram | Lean Manufacturing Diagrams | TQM ...
- Lean Manufacturing Diagrams | Value Stream Mapping | What is ...
- Best Value Stream Mapping mac Software | Lean Manufacturing ...
- Lean Manufacturing Diagrams | Value-Stream Mapping for ...