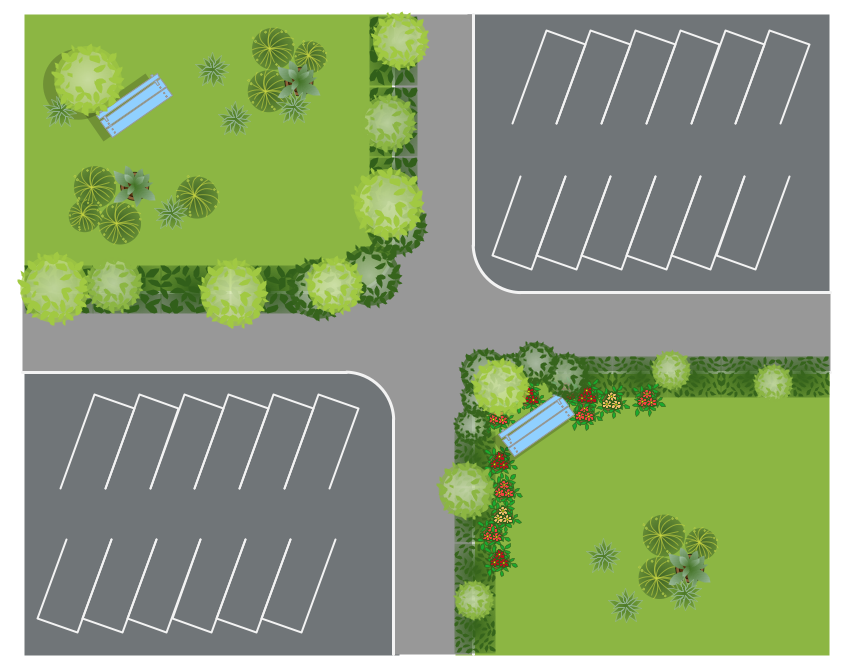
Bubble diagrams in Landscape Design with ConceptDraw DIAGRAM

Bubble diagrams with ConceptDraw DIAGRAM

HelpDesk
How to Create a Bubble Diagram

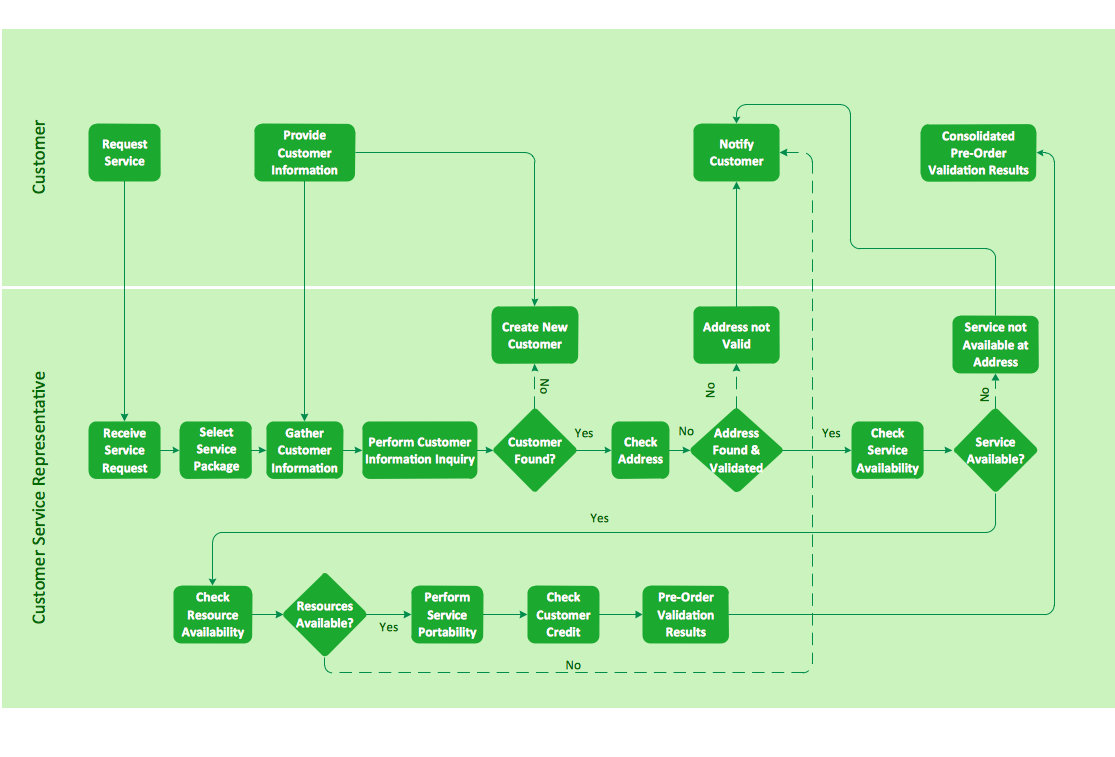
Cross-functional flowchart landscape, U.S. units
Bubble Chart Maker
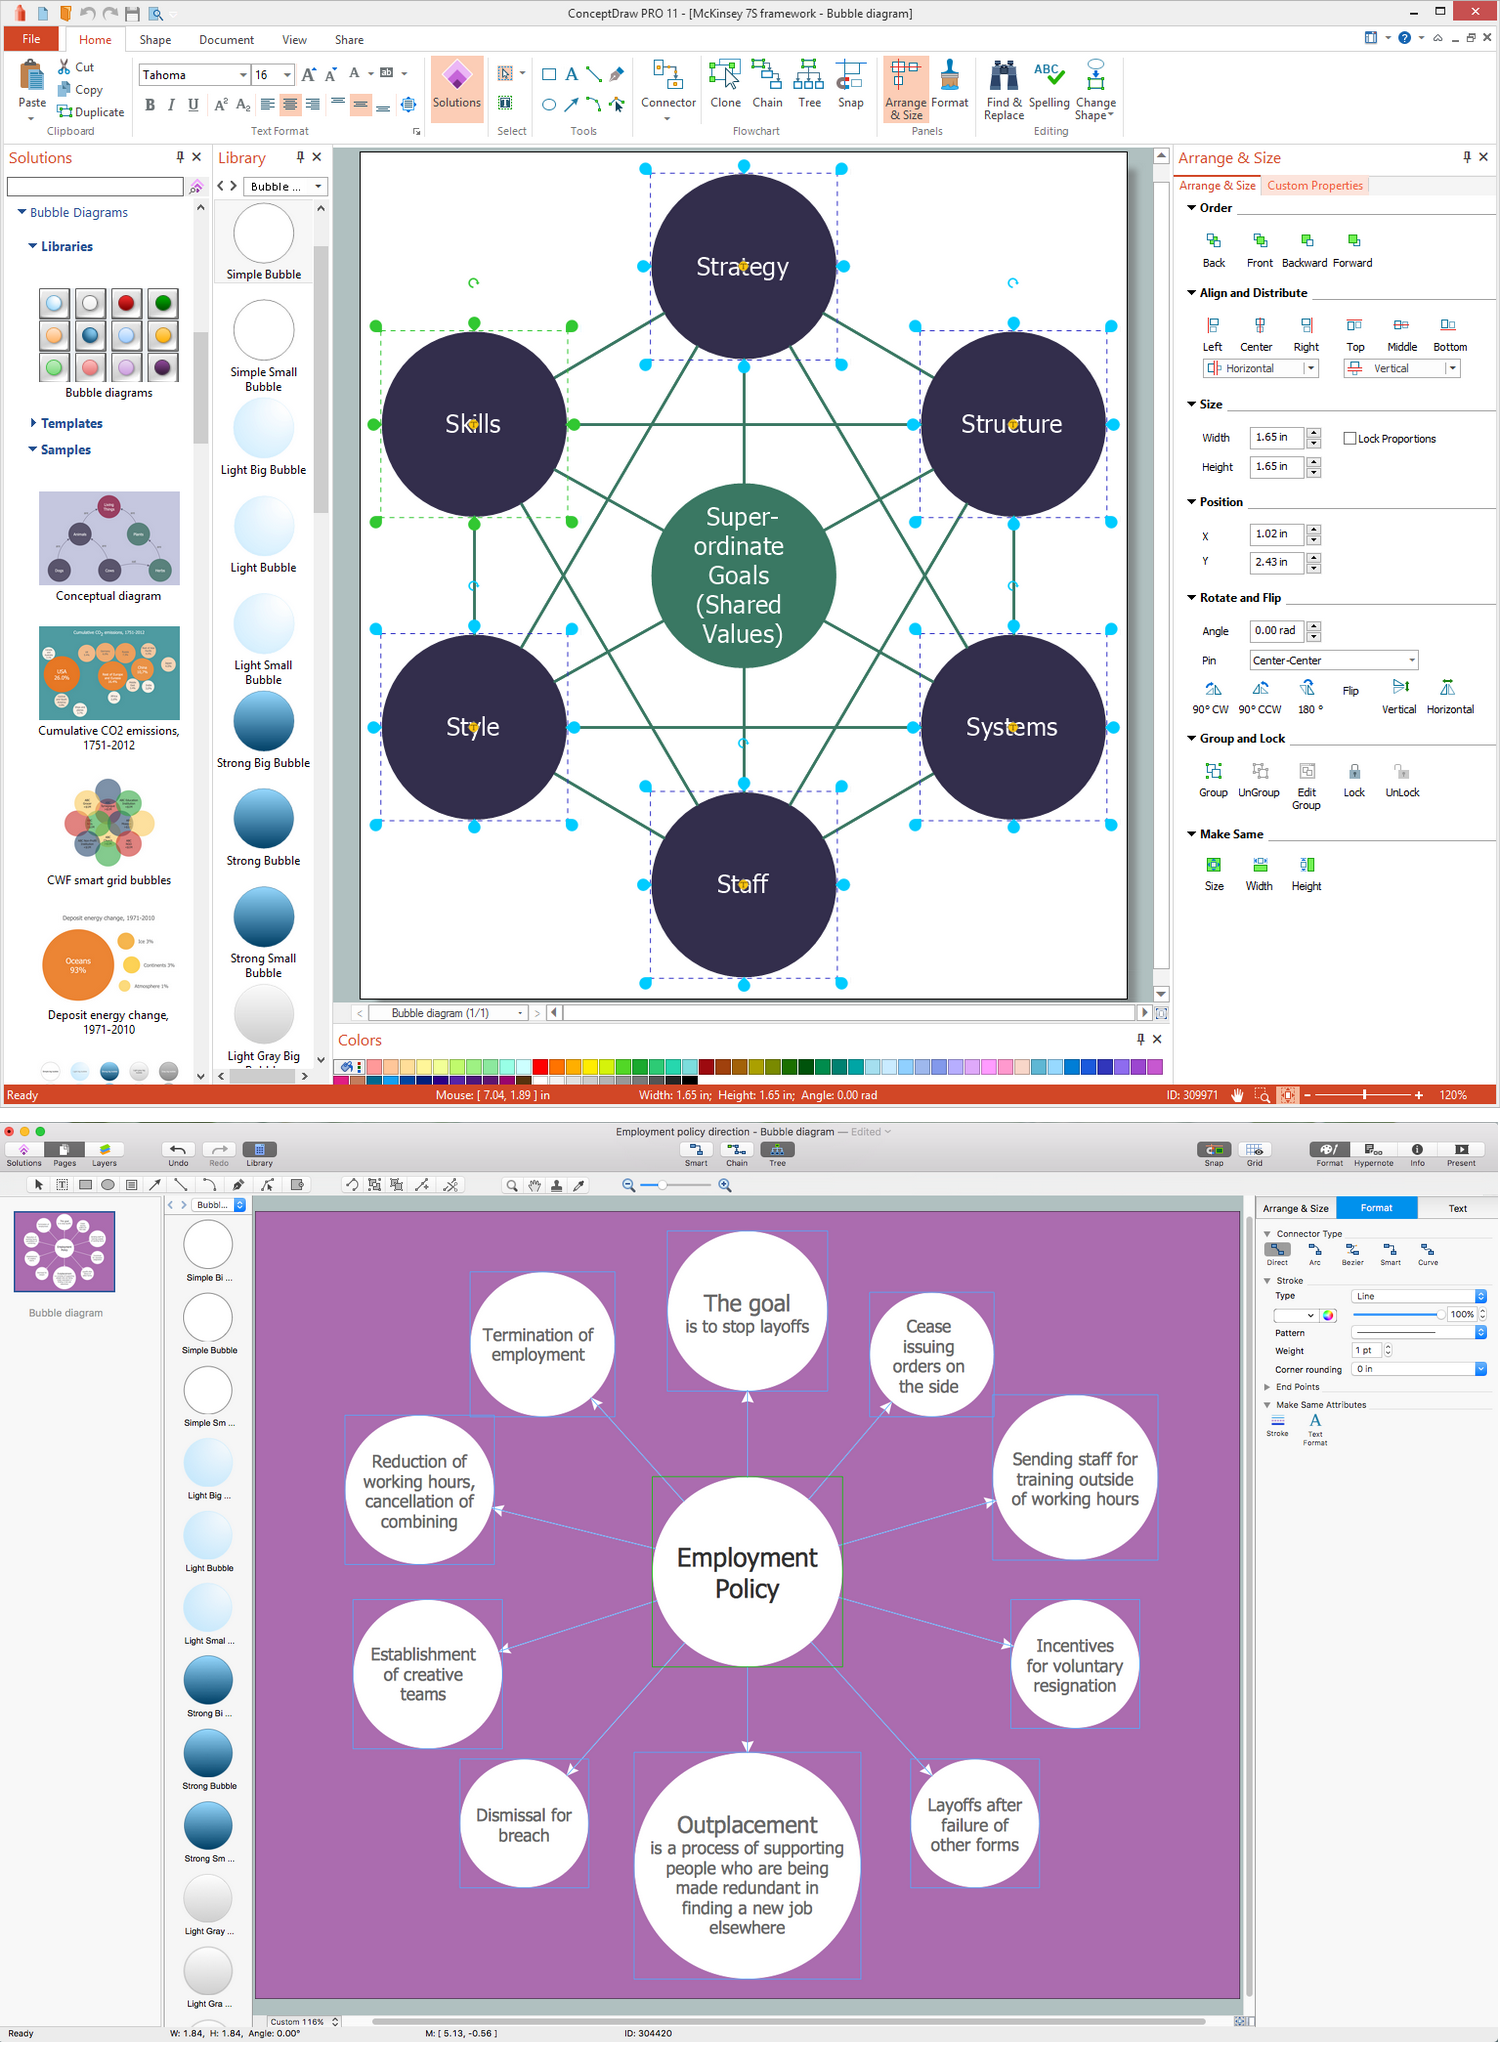
 Bubble Diagrams
Bubble diagrams have enjoyed great success in software engineering, architecture, economics, medicine, landscape design, scientific and educational process, for ideas organization during brainstorming, for making business illustrations, presentations, planning, design, and strategy development. They are popular because of their simplicity and their powerful visual communication attributes.
How To Create a Bubble Chart

CAD Drawing Software for Making Mechanic Diagram and Electrical Diagram Architectural Designs


Restaurant Floor Plans Software

HelpDesk
How to Add a Bubble Diagram to MS Word

HelpDesk
How To Create Visio Bubble Chart

Classroom Seating Chart Maker

Landscape Design Drawings
The Building Blocks Used in EPC Diagrams

Building Drawing Software for Design Site Plan


- Bubble diagrams in Landscape Design with ConceptDraw PRO ...
- Bubble Diagrams | Bubble diagrams in Landscape Design with ...
- Bubble diagrams in Landscape Design with ConceptDraw PRO ...
- Bubble Chart Maker | Bubble Chart | Restaurant Floor Plans ...
- How To use Landscape Design Software | Bubble diagrams in ...
- How To Create Restaurant Floor Plan in Minutes | Bubble diagrams ...
- Basic Flowchart Symbols and Meaning | Bubble diagrams in ...
- Bubble diagram - Template | Bubble diagrams in Landscape Design ...
- How To Draw Building Plans | ConceptDraw Solution Park | Bubble ...
- How To Create a Bubble Chart | Bubble diagrams in Landscape ...
- Landscape Architecture with ConceptDraw PRO | Bubble diagrams ...
- Bubble Chart Maker | How To Create a Bubble Chart | Bubble ...
- Network diagrams with ConceptDraw PRO | UML Diagram | Bubble ...
- Bubble diagrams in Landscape Design with ConceptDraw PRO ...
- How to Add a Bubble Diagram to a PowerPoint Presentation Using ...
- Architectural Bubble Diagram Maker
- Bubble Chart Maker | CAD Drawing Software for Making Mechanic ...
- How To use Architect Software | Landscape & Garden | Bubble ...
- Landscape & Garden | How To use Landscape Design Software ...
- How To Create Restaurant Floor Plan in Minutes | Bubble diagrams ...