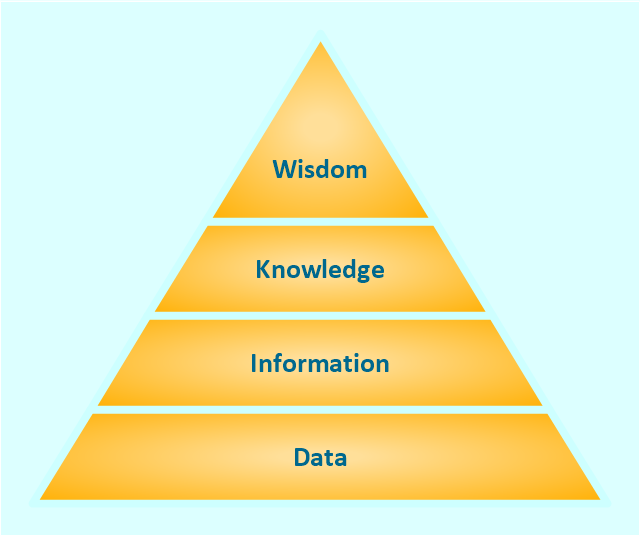
"The DIKW Pyramid, also known variously as the "DIKW Hierarchy", "Wisdom Hierarchy", the "Knowledge Hierarchy", the "Information Hierarchy", and the "Knowledge Pyramid", refers loosely to a class of models for representing purported structural and/ or functional relationships between data, information, knowledge, and wisdom. "Typically information is defined in terms of data, knowledge in terms of information, and wisdom in terms of knowledge"."
[DIKW Pyramid. Wikipedia]
This triangle diagram example of DIKW pyramid has 4 levels: data, information, knowledge and wisdom.
It redesigned using the ConceptDraw PRO diagramming and vector drawing software from Wikimedia Commons file DIKW-diagram.png. [commons.wikimedia.org/ wiki/ File:DIKW-diagram.png]
This file is licensed under the Creative Commons Attribution-Share Alike 3.0 Unported license. [creativecommons.org/ licenses/ by-sa/ 3.0/ deed.en]
The trianglular chart sample "Knowledge hierarchy triangle diagram" is included in the Pyramid Diagrams solution from the Marketing area of ConceptDraw Solution Park.
Pyramid diagram
Pyramid Diagram

Pyramid Diagram

Pyramid Diagram

 Pyramid Diagrams
Pyramid Diagrams solution extends ConceptDraw DIAGRAM software with templates, samples and library of vector stencils for drawing the marketing pyramid diagrams.
Pyramid Diagram

Pyramid Diagram

Typography Art
Pyramid Charts

Pyramid Diagram

Pyramid Diagram

Produce Professional Diagrams More Quickly, Easily and Cost Effectively
Pyramid Diagram

"Waste minimization is the process and the policy of reducing the amount of waste produced by a person or a society.
Waste minimization involves efforts to minimize resource and energy use during manufacture. For the same commercial output, usually the fewer materials are used, the less waste is produced. Waste minimization usually requires knowledge of the production process, cradle-to-grave analysis (the tracking of materials from their extraction to their return to earth) and detailed knowledge of the composition of the waste. ...
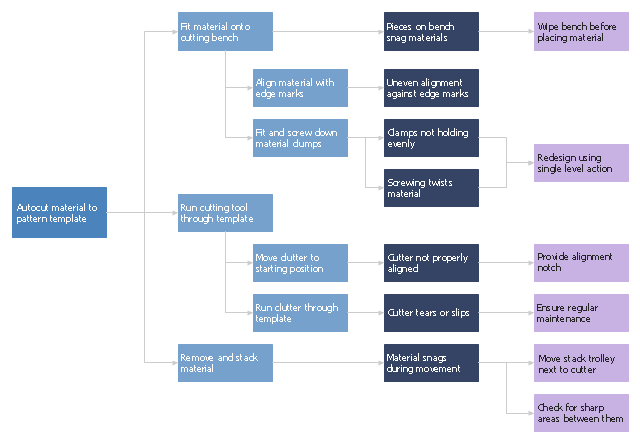
In the waste hierarchy, the most effective approaches to managing waste are at the top. In contrast to waste minimisation, waste management focuses on processing waste after it is created, concentrating on re-use, recycling, and waste-to-energy conversion." [Waste minimisation. Wikipedia]
The process decision program chart (PDPC) example "Minimization of material wastage" was created using the ConceptDraw PRO diagramming and vector drawing software extended with the solution "Seven Management and Planning Tools" from the Management area of ConceptDraw Solution Park.
Waste minimization involves efforts to minimize resource and energy use during manufacture. For the same commercial output, usually the fewer materials are used, the less waste is produced. Waste minimization usually requires knowledge of the production process, cradle-to-grave analysis (the tracking of materials from their extraction to their return to earth) and detailed knowledge of the composition of the waste. ...
In the waste hierarchy, the most effective approaches to managing waste are at the top. In contrast to waste minimisation, waste management focuses on processing waste after it is created, concentrating on re-use, recycling, and waste-to-energy conversion." [Waste minimisation. Wikipedia]
The process decision program chart (PDPC) example "Minimization of material wastage" was created using the ConceptDraw PRO diagramming and vector drawing software extended with the solution "Seven Management and Planning Tools" from the Management area of ConceptDraw Solution Park.
PDPC
Pyramid Diagram

- Knowledge hierarchy triangle diagram | Pyramid Diagram | Pyramid ...
- Pyramid Diagram | Knowledge hierarchy triangle diagram | DIKW ...
- Hierarchy Diagram
- Graham's hierarchy of disagreement - Pyramid diagram | Pyramid ...
- Pyramid Diagram | Pyramid Diagram | Knowledge hierarchy triangle ...
- Knowledge - Venn diagram | Pyramid Diagram | Knowledge ...
- Information Hierarchy Diagram
- Knowledge hierarchy triangle diagram | Organizational Structure ...
- Pyramid Diagram | Knowledge hierarchy triangle diagram ...
- Knowledge hierarchy triangle diagram
- Knowledge Hierarchy Diagram
- What Is Knowledge Hierarchy And Its Component
- Hierarchical Network Topology | Venn Diagram Examples for ...
- Graphs Of Knowledge Hierarchy
- Knowledge Hierarchy Diagram And Importance In An Organisation
- Dikw Pyramid
- Pyramid Diagram | Pyramid Diagram | DIKW hierarchy - 3D Pyramid ...
- The Diagram Of Knowledge Pyramid
- Information Knowledge Wisdom Pyramid
- Pyramid Diagram | Pyramid Diagram | DIKW hierarchy - 3D Pyramid ...