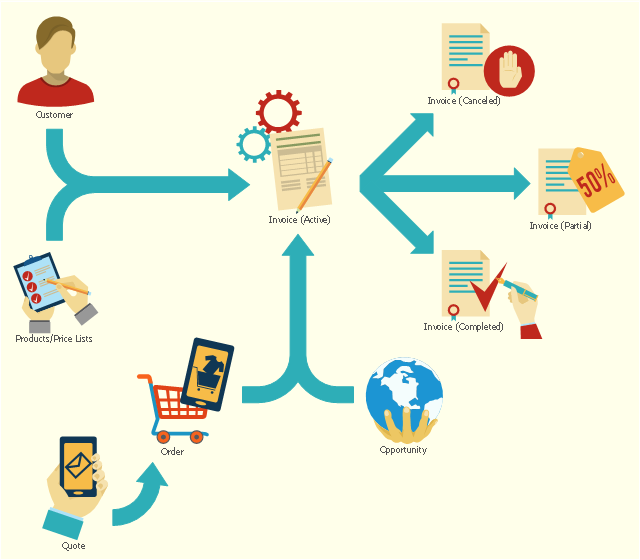
This flowchart example shows the lifecycle of an invoice in Microsoft Dynamics CRM. It was redesigned from the Wikimedia Commons file: Invoice lifecycle.svg. [commons.wikimedia.org/ wiki/ File:Invoice_ lifecycle.svg]
"Microsoft Dynamics CRM is a customer relationship management software package developed by Microsoft. Out of the box, the product focuses mainly on Sales, Marketing, and Service (help desk) sectors...
Dynamics CRM is a server-client application, which, like Microsoft SharePoint, is primarily an IIS-based web application which also supports extensive web services interfaces. Clients access Dynamics CRM either by using a Browser or by a thick client plug-in to Microsoft Outlook." [Microsoft Dynamics CRM. Wikipedia]
The process flowchart example "Invoice lifecycle" was created using the ConceptDraw PRO diagramming and vector drawing software extended with the Sales Flowcharts solution from the Marketing area of ConceptDraw Solution Park.
Lifecycle of an invoice in Microsoft Dynamics CRM
Flow Chart Symbols

Purchasing Flowchart - Purchase Order. Flowchart Examples

 Business Process Diagrams
Business Process Diagrams solution extends the ConceptDraw PRO BPM software with RapidDraw interface, templates, samples and numerous libraries based on the BPMN 1.2 and BPMN 2.0 standards, which give you the possibility to visualize equally easy simple and complex processes, to design business models, to quickly develop and document in details any business processes on the stages of project’s planning and implementation.
Graphical Symbols to use in EPC diagrams
")
 Sales Flowcharts
The Sales Flowcharts solution lets you create and display sales process maps, sales process workflows, sales steps, the sales process, and anything else involving sales process management.
 Flowcharts
The Flowcharts solution for ConceptDraw PRO is a comprehensive set of examples and samples in several varied color themes for professionals that need to represent graphically a process. Solution value is added by the basic flow chart template and shapes' libraries of flowchart notation. ConceptDraw PRO flow chart creator lets one depict the processes of any complexity and length, as well as design the Flowchart either vertically or horizontally.
Basic Flowchart Symbols and Meaning


How to Create Flowcharts for an Accounting Information System

Work Order Process Flowchart. Business Process Mapping Examples

Data Modeling with Entity Relationship Diagram

Work Flow Process Chart

Types of Welding in Flowchart

Business Processes

ConceptDraw Arrows10 Technology

- Invoice payment process - Flowchart | Flow Chart Symbols ...
- Accounting Flowchart Purchasing Receiving Payable and Payment ...
- Sale Invoice Flowchart
- Invoice lifecycle | Flowchart Example: Flow Chart of Marketing ...
- Invoice Crm Flowchart
- How to Build a Flowchart | Invoice lifecycle | How to draw Metro Map ...
- Invoice payment process - Flowchart | Accounting Flowchart ...
- Invoice lifecycle | Sales Process Flowchart . Flowchart Examples ...
- Server Interface Client Flowchart
- Sales Process Flowcharts | Lead to opportunity sales flow | Invoice ...
- Invoice lifecycle | Process Flow Chart Software Free | Use the Best ...
- Invoice lifecycle | Sales Process Flowcharts | Sales Flowcharts ...
- Crm Flow Chart
- Accounting Flowchart Symbols | Flow Chart Symbols | Invoice ...
- Invoice lifecycle | Lead to opportunity sales flow | Sales Process ...
- How To Present Flowchart Process For Sales Life Cycle In Ms Crm
- Invoice lifecycle | Marketing and Sales Organization chart ...
- UML Class Diagram Example for Transport System | Invoice lifecycle ...
- Invoice lifecycle | Star Network Topology | Lead to opportunity sales ...