HelpDesk
How to Create a Time Series Dashboard

 Organizational Charts
Organizational Charts solution extends ConceptDraw DIAGRAM software with samples, templates and library of vector stencils for drawing the org charts.
HelpDesk
How to Use ConceptDraw Sales Dashboard Solution

HelpDesk
How to Create a Sales Dashboard

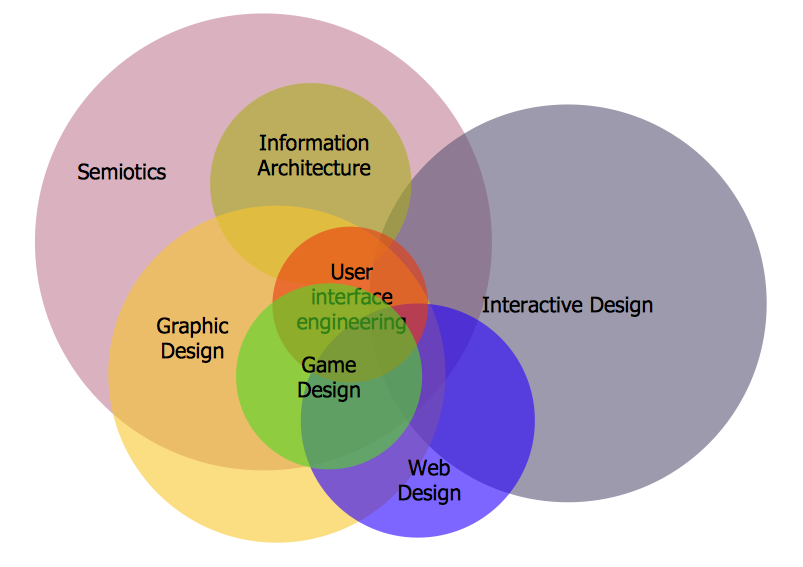
Interactive Venn Diagram
 ConceptDraw Solution Park
ConceptDraw Solution Park collects graphic extensions, examples and learning materials
HelpDesk
How to Create an Interactive Voice Response (IVR) Diagram
 Diagram")
 25 Typical Orgcharts
The 25 Typical Orgcharts solution contains powerful organizational structure and organizational management drawing tools, a variety of professionally designed organization chart and matrix organization structure samples, 25 templates based on various orga
HelpDesk
How to Create a Meter Dashboard

Pyramid Diagram and Pyramid Chart

 Interactive Voice Response Diagrams
Interactive Voice Response Diagrams solution extends ConceptDraw DIAGRAM software with samples, templates and libraries of ready-to-use vector stencils that help create Interactive Voice Response (IVR) diagrams illustrating in details a work of interactive voice response system, the IVR system’s logical and physical structure, Voice-over-Internet Protocol (VoIP) diagrams, and Action VoIP diagrams with representing voice actions on them, to visualize how the computers interact with callers through voice recognition and dual-tone multi-frequency signaling (DTMF) keypad inputs.
HelpDesk
How to Create Education Infographics

HelpDesk
How to Create a Rack Diagram

HelpDesk
How to Create Management Infographics

HelpDesk
How to Connect a Live Object to a Text Data Source

HelpDesk
How to Organize a Social Media Activity
Network Visualization with ConceptDraw DIAGRAM

HelpDesk
How to Use Mind Maps During a Lecture

 Target and Circular Diagrams
This solution extends ConceptDraw DIAGRAM software with samples, templates and library of design elements for drawing the Target and Circular Diagrams.
- Examples of Flowcharts, Org Charts and More | What is Interactive ...
- ConceptDraw PRO - Organizational chart software | Organizational ...
- Examples of Flowcharts, Org Charts and More | Business diagrams ...
- Example of Organizational Chart | Organizational Charts | Horizontal ...
- Directional Maps | Directions Maps | ConceptDraw Solution Park ...
- How to Draw an Organization Chart | Pie Chart Examples and ...
- How to Draw an Organization Chart | ConceptDraw PRO ...
- Basic Diagramming | ConceptDraw PRO - Organizational chart ...
- Pie Chart Software | Bar Chart Software | ConceptDraw PRO ...
- Design elements - TQM diagram | Process Flowchart | Business ...
- How to Create Organizational Chart Quickly | How to Draw an ...
- Organizational Charts | Network organization chart | How to Draw an ...
- Organizational Structure | How to Draw an Organizational Chart ...
- Organizational Structure | ConceptDraw PRO - Organizational chart ...
- Examples of Flowcharts, Org Charts and More | How to Connect Text ...
- Bubble Diagrams | Language Learning | Interactive Voice Response ...
- How to Draw an Organization Chart | Organizational Structure | How ...
- Data Flow Diagrams (DFD) | Telecommunication Network Diagrams ...
- Flow Chart Online | What is Interactive Flowcharts | How to Create a ...
- How to Draw an Organizational Chart with ConceptDraw PRO | How ...