Gant Chart in Project Management


Pyramid Diagram

 IDEF0 Diagrams
IDEF0 Diagrams visualize system models using the Integration Definition for Function Modeling (IDEF) methodology. Use them for analysis, development and integration of information and software systems, and business process modelling.
Building Drawing. Design Element Site Plan
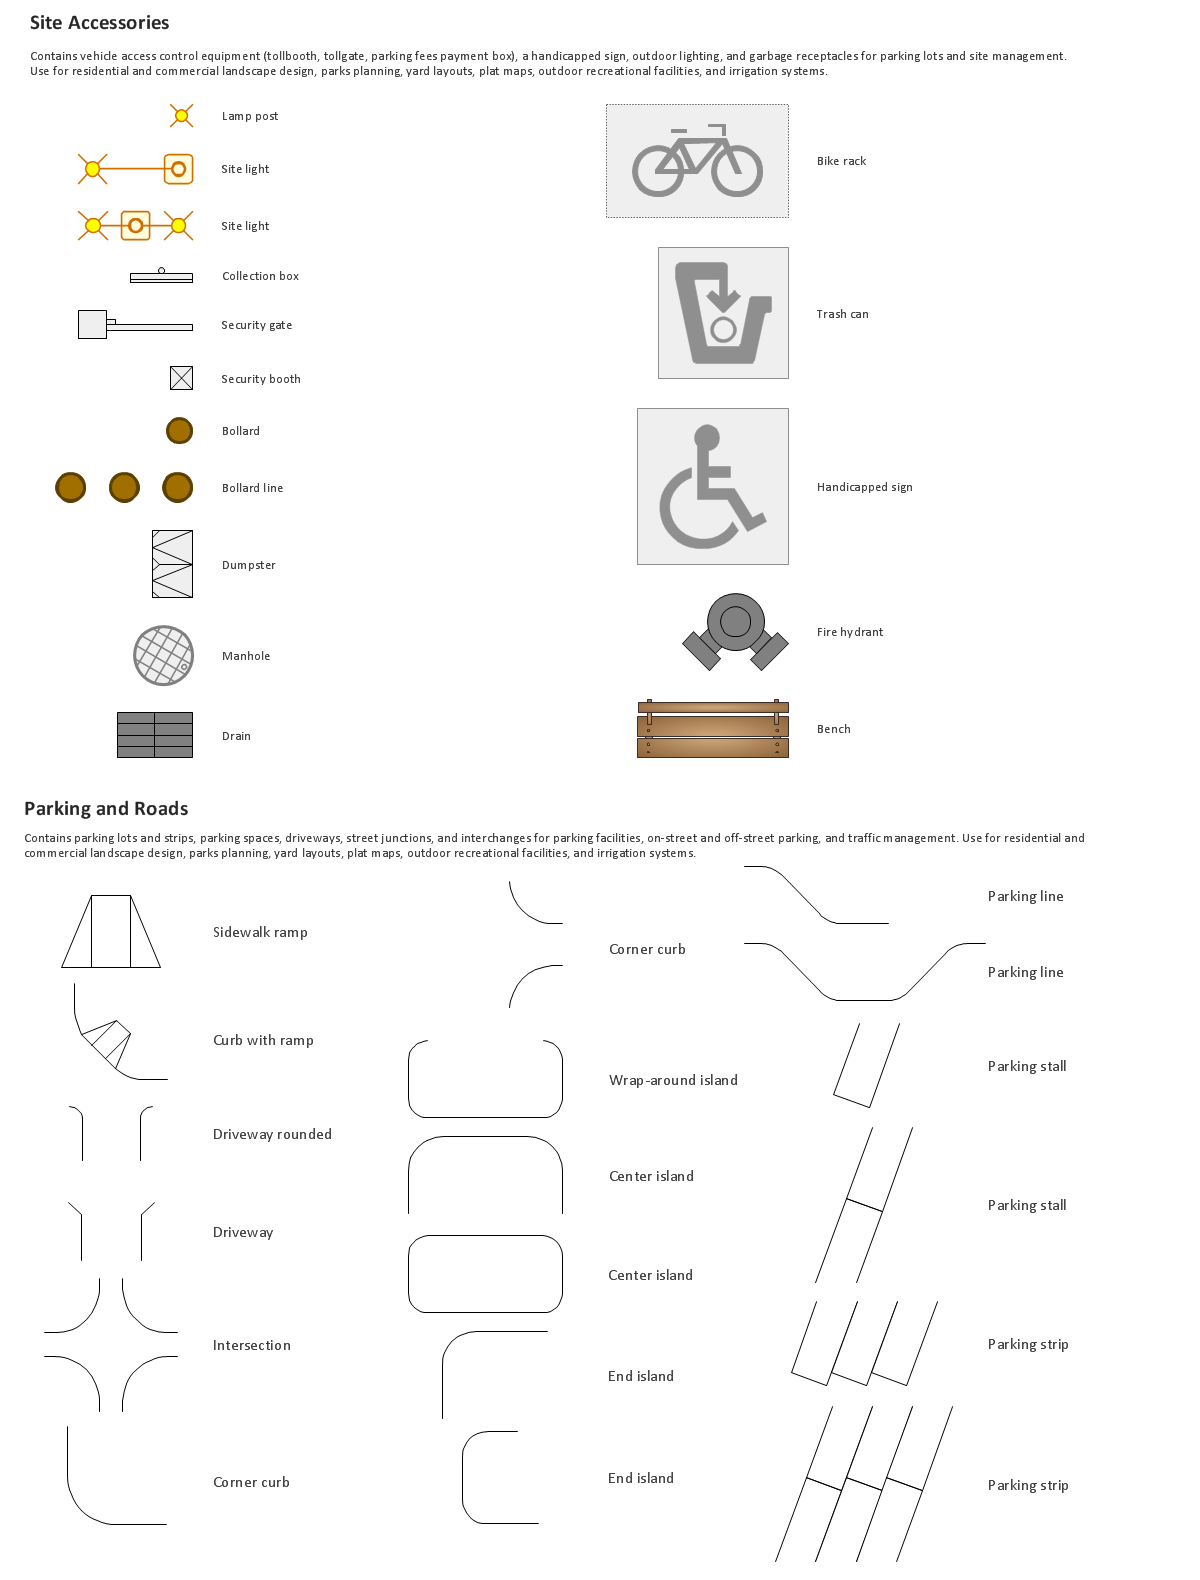

Building Drawing Software for Design Site Plan

Basic Flowchart Symbols and Meaning


Management Tools — Total Quality Management

Total Quality Management Value

 Azure Architecture
Azure Architecture solution bundles into one handy tool everything you need to create effective Azure Architecture diagrams. It adds the extra value to versatile ConceptDraw DIAGRAM software and extends the users capabilities with comprehensive collection of Microsoft Azure themed graphics, logos, preset templates, wide array of predesigned vector symbols that covers the subjects such as Azure management, Azure storage, and Azure services, amongst others, and allow you to illustrate Azure Architecture diagrams at any degree of complexity, to present visually your Azure cloud system architecture with professional style, to design Azure cloud topology, to document Windows Azure Architecture and Azure Cloud System Architecture, to visualize the great abilities and work of Microsoft Azure Cloud System and Azure services.
- Sample Project Flowchart. Flowchart Examples | Project ...
- Project management life cycle - Flowchart | Audit flowchart - Project ...
- Project Plan Brainstorming
- Example Of Project Time Management
- Audit flowchart - Project management process | Project management ...
- Sample Project Flowchart. Flowchart Examples | Flowchart ...
- Project management life cycle - Flowchart | Program to Make Flow ...
- Project management life cycle - Flowchart | Process Flowchart ...
- Flowchart Programming Project. Flowchart Examples | Sample ...
- Gantt charts for planning and scheduling projects | Project ...