Information Technology Architecture

Process Flowchart


A five level pyramid model of different types of Information Systems based on the information processing requirement of different levels in the organization. The first level represents transaction processing systems to process basic data. The second level represents office support systems to process information in office. The third level represents management information systems to process information by managers. The fourth level represents decision support systems to process explicit knowledge. The fifth level represents executive information systems to process tacit knowledge.
"A Computer(-Based) Information System is essentially an IS using computer technology to carry out some or all of its planned tasks. The basic components of computer based information system are:
(1) Hardware - these are the devices like the monitor, processor, printer and keyboard, all of which work together to accept, process, show data and information.
(2) Software - are the programs that allow the hardware to process the data.
(3) Databases - are the gathering of associated files or tables containing related data.
(4) Networks - are a connecting system that allows diverse computers to distribute resources.
(5) Procedures - are the commands for combining the components above to process information and produce the preferred output.
The first four components (hardware, software, database and network) make up what is known as the information technology platform. Information technology workers could then use these components to create information systems that watch over safety measures, risk and the management of data. These actions are known as information technology services." [Information systems. Wikipedia]
This pyramid diagram was redesigned using the ConceptDraw PRO diagramming and vector drawing software from Wikimedia Commons file Five-Level-Pyramid-model.png. [commons.wikimedia.org/ wiki/ File:Five-Level-Pyramid-model.png]
This file is licensed under the Creative Commons Attribution 3.0 Unported license. [creativecommons.org/ licenses/ by/ 3.0/ deed.en]
The triangle chart example "Information systems types" is included in the Pyramid Diagrams solution from the Marketing area of ConceptDraw Solution Park.
Pyramid diagram

Technical Drawing Software

Azure Management

Network Configuration
 services")

This enterprise architecture diagram sample was drawn on the base of the figure illustrating the webpage "Enterprise Architecture" from the United States Department of Agriculture (USDA) website.
"The USDA's Enterprise Architecture program strategically partners with all agencies to provide value to USDA's mission areas, business processes, and Information Technology (IT) capabilities.
Introduction.
The USDA Enterprise Architecture (EA) helps make sure information technology investments align with the mission and goals of the Department. It defines how information and technology should support USDA’s strategic goals and benefit the business.
Purpose.
The intent of the USDA Enterprise Architecture is to help make the information technology (IT) expenditures more effectively serve the mission and goals of the organization. Enterprise architecture defines how information and technology support USDA’s strategic planning to benefit our business. There are many ways to organize the information and diagrams that make up the architecture."
[ocio.usda.gov/ about-ocio/ governance-and-strategic-investment-gsi/ enterprise-architecture]
The enterprise architecture diagram example "USDA's Enterprise Architecture" was created using the ConceptDraw PRO diagramming and vector drawing software extended with the Enterprise Architecture Diagrams solution from the Management area of ConceptDraw Solution Park.
Enterprise architecture diagram
HR infographics "Electronic human resources (E-HR)" was redesigned from the Wikimedia Commons file: Ehr diagram.jpg. [commons.wikimedia.org/ wiki/ File:Ehr_ diagram.jpg]
This file is licensed under the Creative Commons Attribution-Share Alike 3.0 Unported license. [creativecommons.org/ licenses/ by-sa/ 3.0/ ]
"E-HR is a function of HR that is concerned with the use, management, and regulation of electronic information and processes within an organization.
E-HR is different from E-HRM (Electronic Human Resource Management) and HRIS (Human Resource Information System) which are uses of technology. More specifically, E-HRM is a system that allows management and employees access to human resource related information and services through an organization's intranet or web portal. HRIS refers to enterprise resource planning software that streamlines human resource functions such as payroll.
In contrast, E-HR is a function of human resources that requires cross-functional knowledge and collaboration between multiple departments, most notably human resources and information technology." [Electronic human resources. Wikipedia]
The HR infographics example "Electronic human resources (E-HR)" was created using the ConceptDraw PRO diagramming and vector drawing software extended with the HR Flowcharts solution from the Management area of ConceptDraw Solution Park.
HR infographics
.png--diagram-flowchart-example.png)
Used Solutions
Azure Services

The vector stencils library "Meter indicators" contains 29 Live Objects: speedometer gauge, dial, bullet graph, slider and level meter visual indicators.
The Live Objects designed to display actual measures of performance metrics and KPIs from external data source files.
Some of them also display comparative measures, and colored zones of qualitative ranges with legend.
Use it to draw business performance dashboards using the ConceptDraw PRO diagramming and vector drawing software .
"Digital dashboards may be laid out to track the flows inherent in the business processes that they monitor. Graphically, users may see the high-level processes and then drill down into low level data. This level of detail is often buried deep within the corporate enterprise and otherwise unavailable to the senior executives. ...
Specialized dashboards may track all corporate functions. Examples include human resources, recruiting, sales, operations, security, information technology, project management, customer relationship management and many more departmental dashboards. ...
Like a car's dashboard (or control panel), a software dashboard provides decision makers with the input necessary to "drive" the business. Thus, a graphical user interface may be designed to display summaries, graphics (e.g., bar charts, pie charts, bullet graphs, "sparklines," etc.), and gauges (with colors similar to traffic lights) in a portal-like framework to highlight important information. ...
Digital dashboards allow managers to monitor the contribution of the various departments in their organization. To gauge exactly how well an organization is performing overall, digital dashboards allow you to capture and report specific data points from each department within the organization, thus providing a "snapshot" of performance." [Dashboard (management information systems). Wikipedia]
The example "Design elements - Meter indicators" is included in the Meter Dashboard solution from the area "What is a Dashboard" of ConceptDraw Solution Park.
Visual indicators

This financila dashboard example was drawn on the base of the Enterprise dashboard from the Mecklenburg County Government website.
[charmeck.org/ mecklenburg/ county/ CountyManagersOffice/ OMB/ dashboards/ Pages/ Enterprise.aspx]
"In management information systems, a dashboard is "an easy to read, often single page, real-time user interface, showing a graphical presentation of the current status (snapshot) and historical trends of an organization’s key performance indicators to enable instantaneous and informed decisions to be made at a glance."
For example, a manufacturing dashboard may show key performance indicators related to productivity such as number of parts manufactured, or number of failed quality inspections per hour. Similarly, a human resources dashboard may show KPIs related to staff recruitment, retention and composition, for example number of open positions, or average days or cost per recruitment.
Types of dashboards.
Dashboard of Sustainability screen shot illustrating example dashboard layout.
Digital dashboards may be laid out to track the flows inherent in the business processes that they monitor. Graphically, users may see the high-level processes and then drill down into low level data. This level of detail is often buried deep within the corporate enterprise and otherwise unavailable to the senior executives.
Three main types of digital dashboard dominate the market today: stand alone software applications, web-browser based applications, and desktop applications also known as desktop widgets. The last are driven by a widget engine.
Specialized dashboards may track all corporate functions. Examples include human resources, recruiting, sales, operations, security, information technology, project management, customer relationship management and many more departmental dashboards.
Digital dashboard projects involve business units as the driver and the information technology department as the enabler. The success of digital dashboard projects often depends on the metrics that were chosen for monitoring. Key performance indicators, balanced scorecards, and sales performance figures are some of the content appropriate on business dashboards." [Dashboard (management information systems). Wikipedia]
The example "Enterprise dashboard" was created using the ConceptDraw PRO diagramming and vector drawing software extended with the Composition Dashboard solution from the area "What is a Dashboard" of ConceptDraw Solution Park.
Financial dashboard

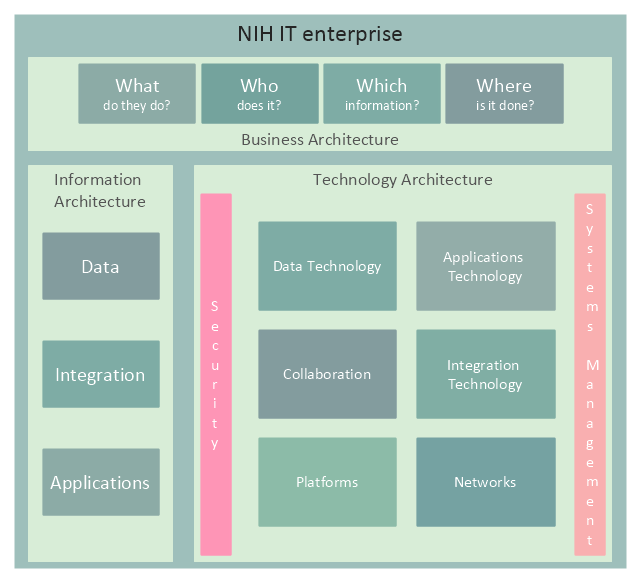
This enterprise architecture diagram sample was redesigned from the illustration of the NIH Enterprise Architecture website. [enterprisearchitecture.nih.gov/ Pages/ Framework.aspx]
"Enterprise architecture is a comprehensive framework used to manage and align an organization's Information Technology (IT) assets, people, operations, and projects with its operational characteristics. In other words, the enterprise architecture defines how information and technology will support the business operations and provide benefit for the business.
It illustrates the organization’s core mission, each component critical to performing that mission, and how each of these components is interrelated. These components include:
(1) Guiding principles,
(2) Organization structure,
(3) Business processes,
(4) People or stakeholders,
(5) Applications, data, and infrastructure,
(6) Technologies upon which networks, applications and systems are built.
Guiding principles, organization structure, business processes, and people don’t sound very technical. That’s because enterprise architecture is about more than technology. It is about the entire organization (or enterprise) and identifying all of the bits and pieces that make the organization work." [enterprisearchitecture.nih.gov/ Pages/ what.aspx]
The example "NIH IT enterprise architecture framework" was created using the ConceptDraw PRO diagramming and vector drawing software extended with the Enterprise Architecture Diagrams solution from the Management area of ConceptDraw Solution Park.
Enterprise architecture diagram
 Cloud Computing Diagrams
The Cloud Computing Diagrams solution extends the functionality of the ConceptDraw PRO diagramming software with a comprehensive collection of libraries of commonly accepted cloud computing vector stencils to help you to get started designing Cloud Computing Diagrams, Architecture Diagrams and Cloud Computing Architecture Diagrams without effort. This solution lets one professionally depict the way how the cloud computing works, allows giving a powerful introduction to the Cloud computing architecture and Amazon cloud computing architecture, to display the essence of the cloud computing, the main characteristics and classification of the cloud services thanks to the wide variety of predesigned samples and examples.
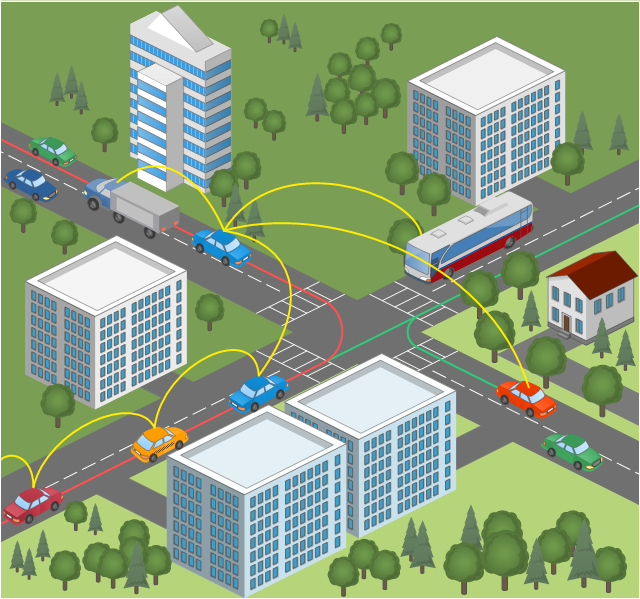
This vehicular network diagram sample was drawn on the base of picture illustrating the post "Intelligent transportation system" from the blog "Technology New Here".
"Intelligent transportation systems are projects that aim to integrate modern communication and information technology into existing transportation management systems in order to optimize vehicle life, fuel efficiency, safety, and traffic in urbanized cities.
The need for intelligent transportation systems stems from the fact that traffic congestion has been increasing all around the world because of increasing population, increasing amount of transportation vehicles and increasing urbanization."
[technologynewhere.wordpress.com/ 2010/ 05/ 12/ intelligent-transportation-system/ ]
The vehicular network diagram example "Intelligent transportation system" was created using the ConceptDraw PRO diagramming and vector drawing software extended with the Vehicular Networking solution from the Computer and Networks area of ConceptDraw Solution Park.
Vehicular network diagram
Used Solutions
- Information Technology Architecture | Process Flowchart | Flow chart ...
- How to Draw an Organization Chart | Information Technology ...
- Information Technology Related Drawings Easy
- Information Technology Chart Drawing
- Information Technology Architecture | Technical Drawing Software ...
- Information Technology Diagram Draw
- Information Technology Architecture | Process Flowchart | How To ...
- Information Technology Architecture | 5 Level pyramid model ...
- Information Technology Architecture | Educational Technology Tools ...
- Educational Technology Tools | Information Technology Architecture ...
- Chart Of Management Information System With Diagram
- Design elements - Technology | Design Diagrams the Fast and Easy ...
- Apple Information Technology
- Information Technology Example Of Flow Charts
- Drawing Chart Of Information Technology Of A Computer System
- Information Technology Architecture | Process Flowchart | Basic ...
- Process Flowchart | Information Technology Architecture | Basic ...
- Information Technology Architecture | Manufacturing 8 Ms fishbone ...
- Information Technology Architecture | Process Flowchart | 5 Level ...
- Information Technology Architecture | Campus Area Networks (CAN ...