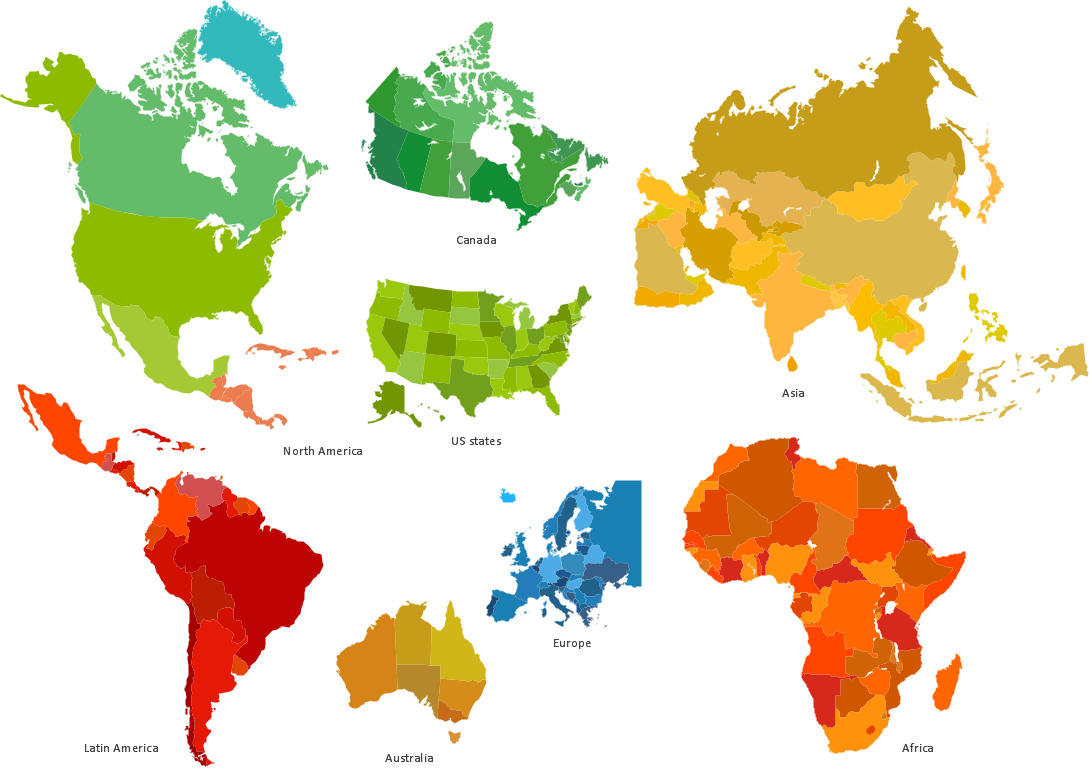
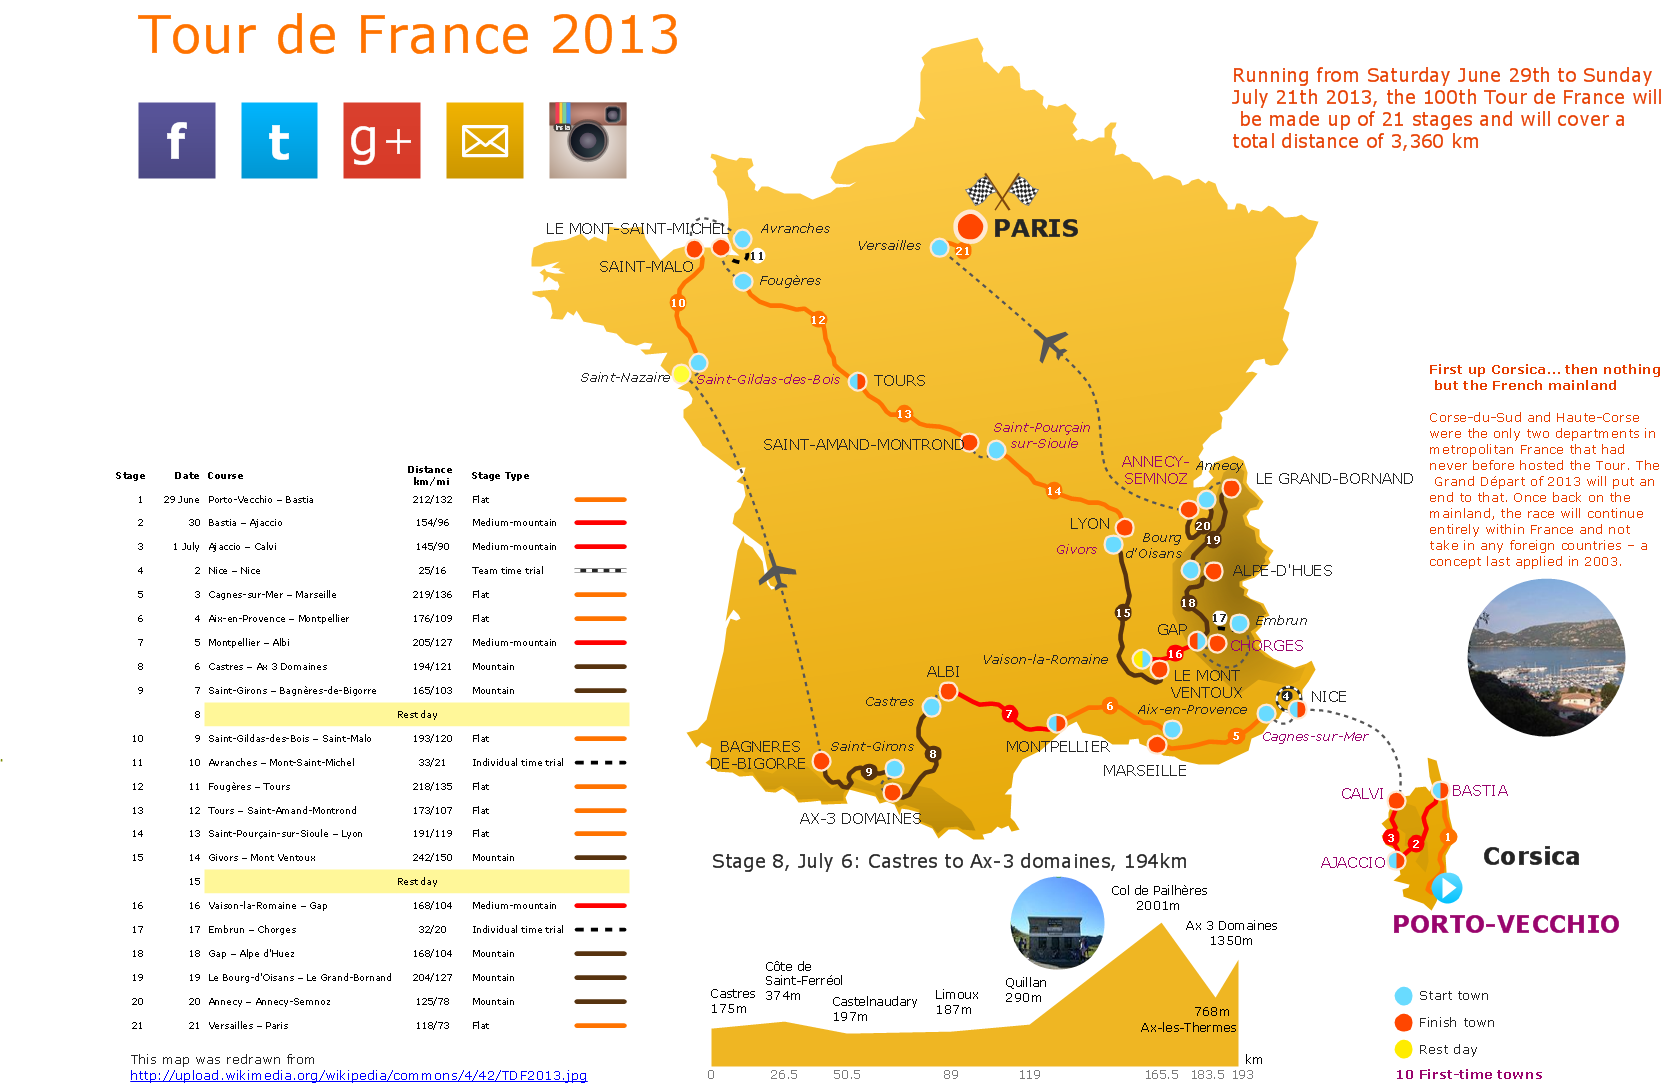
Spatial infographics Design Elements: Transport Map
Do you like infographics and data visualization? Creating infographics is super-easy with ConceptDraw.Informative and Well-Designed Infographics
Informative and well-designed Infographics allows visually present various map containing information.
 Bar Graphs
The Bar Graphs solution enhances ConceptDraw PRO v10 functionality with templates, numerous professional-looking samples, and a library of vector stencils for drawing different types of Bar Graphs, such as Simple Bar Graph, Double Bar Graph, Divided Bar Graph, Horizontal Bar Graph, Vertical Bar Graph, and Column Bar Chart.
Superb Examples of Infographic Maps
Great examples of Infographic Maps, they are needed for inspiration.HelpDesk
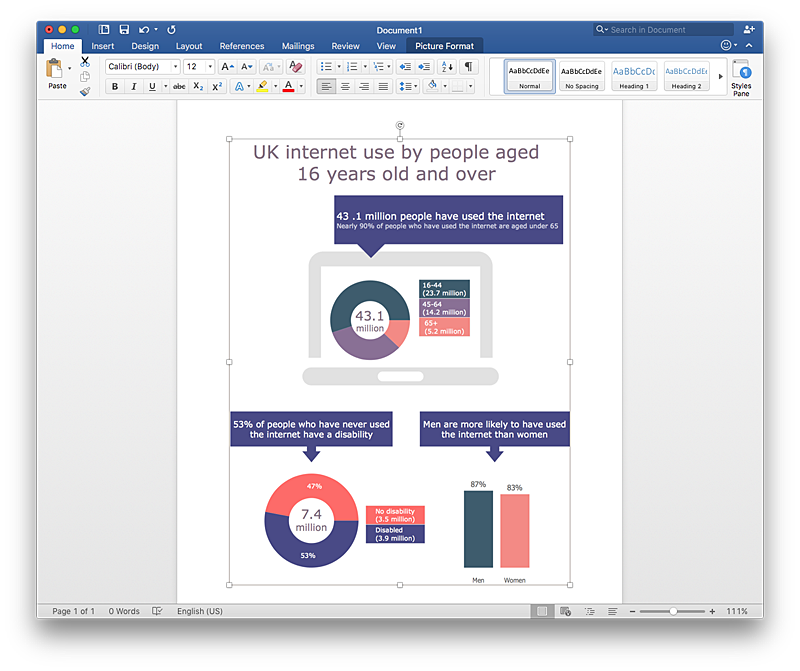
How to Add Data-driven Infographics to a MS Word Document Using ConceptDraw PRO
Infographics ae usually used as an effective way of showing a certain portion of information . There are a wide of range of subjects that can be represented in a such way. One of the most simple usage for the infographics, in business diagrams. Sales staff can use it as an effective method of sharing the sales results with the entire team and stakeholders. ConceptDraw Data-driven Infographics solution gives all the tools one need to present a certain type of data. ConceptDraw PRO allows you to easily create data-driven infographics and then insert them into a MS Word document.Scatter Graph Charting Software
ConceptDraw provides some interactive xy chart and scatter graph symbols that offers advanced features yet is simple to use.
 Picture Graphs
Typically, a Picture Graph has very broad usage. They many times used successfully in marketing, management, and manufacturing. The Picture Graphs Solution extends the capabilities of ConceptDraw PRO v10 with templates, samples, and a library of professionally developed vector stencils for designing Picture Graphs.
Sample Pictorial Chart. Sample Infographics
Sample Pictorial Chart - Pictorial Infographics solution provides easy-to-use design infographics drawing tools, large collection of different sample infographics and infograms, sample pictorial chart and templates to be filled in, and 10 libraries with great quantity of predesigned vector pictograms. Use Pictorial Infographics solution to draw your own design pictorial infographics documents quick and easy.How to draw Metro Map style infographics? Moscow, New York, Los Angeles, London
The solution handles designs of any complexity, and the comprehensive library covers all key aspects of a transportation system. To further enhance your map design, there is the option to embed links, that can display station images or other relevant, important information. We have also included a set of samples in the solution, that show the possible real-world application — complex tube systems including the London Tube and New York City Subway show the level of detail possible when using the Metro Map Solution.
 What are Infographic Area
Solutions of the area What is Infographics from ConceptDraw Solution Park collect templates, samples and vector stencils libraries with design elements for the drawing information graphics.
 Line Graphs
How to draw a Line Graph with ease? The Line Graphs solution extends the capabilities of ConceptDraw PRO v10 with professionally designed templates, samples, and a library of vector stencils for drawing perfect Line Graphs.
- Data Infographics | Infographic Tools | Design Elements - Data ...
- Sample Pictorial Chart . Sample Infographics | Design elements ...
- Sample Pictorial Chart . Sample Infographics | Picture Graphs ...
- Scatter Graph Charting Software | Sample Pictorial Chart . Sample ...
- Picture Graph | Tools to Create Your Own Infographics | Feature ...
- Infographic Maker | Line Graphs | Basic Diagramming | Infographics ...
- Basic Diagramming | Sample Pictorial Chart . Sample Infographics ...
- Basic Diagramming | Line Chart Examples | Line Graph | An Easy ...
- Pictorial Chart | Sample Pictorial Chart . Sample Infographics ...
- Images On World Population For Chart Making
- Bar Graphs | How to Create PowerPoint Presentation from Data ...
- Infographic Maker | Sample Pictorial Chart . Sample Infographics ...
- Sample Pictorial Chart . Sample Infographics | Business Report Pie ...
- Line Chart Examples | Line Graph | Pictures of Graphs | Population ...
- Chart Maker for Presentations | Football | Spatial Infographics ...
- Marketing Infographics | How to Create Marketing Infographics ...
- Sample Pictorial Chart . Sample Infographics | Line Chart Examples ...
- Graph Presentation Time Series Infographics
- Design Pictorial Infographics . Design Infographics | How to Draw a ...
- Create Charts And Graphs For Ppt Presentations


