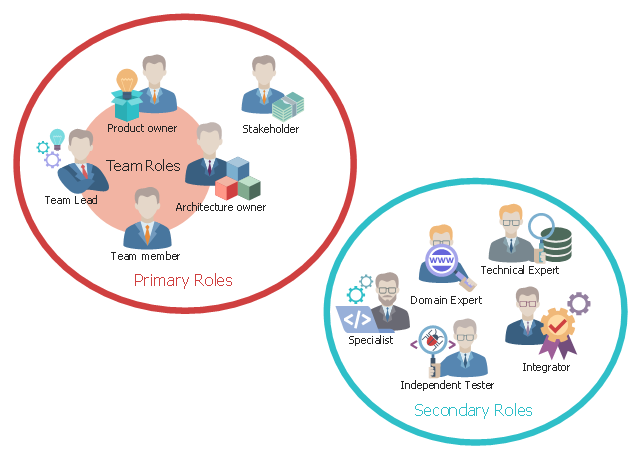
This agile software development infographic example illustrates roles in disciplined agile delivery (DAD).
"Disciplined agile delivery (DAD) is a process decision framework that enables simplified process decisions around incremental and iterative solution delivery. DAD builds on the many practices espoused by advocates of agile software development, including Scrum, agile modeling, lean software development, and others." [Disciplined agile delivery. Wikipedia]
The infographic sample "Roles on DAD teams" was created using the ConceptDraw PRO software extended with the Scrum solution from the Project Management area of ConceptDraw Solution Park.
Infographic
Used Solutions
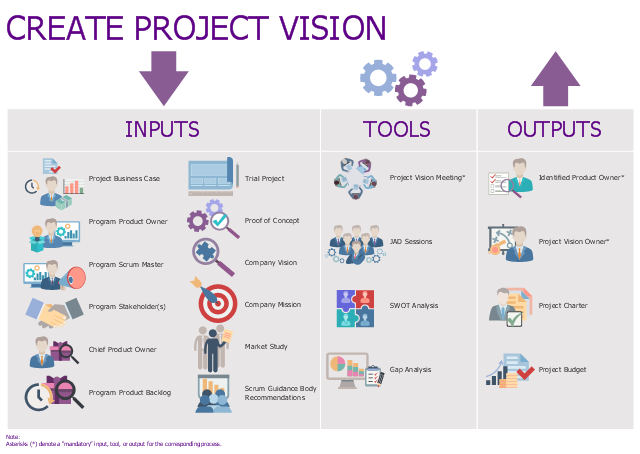
This infographic example was designed on the base of Fig. 8-3 "Create Project Vision — Inputs, Tools, and Outputs " on the page 137 of the "A Guide to the SCRUM BODY OF KNOWLEDGE (SBOK™ Guide) 2016 Edition".
" Create Project Vision — In this process, the Project Business Case is reviewed to create a Project Vision Statement that will serve as the inspiration and provide focus for the entire project. The Product Owner is identified in this process."
[scrumstudy.com/ SBOK/ SCRUMstudy-SBOK-Guide-2013.pdf]
This example of agile software development infographic was created using the ConceptDraw PRO software extended with the Scrum solution from the Project Management area of ConceptDraw Solution Park.
Infographic
Used Solutions
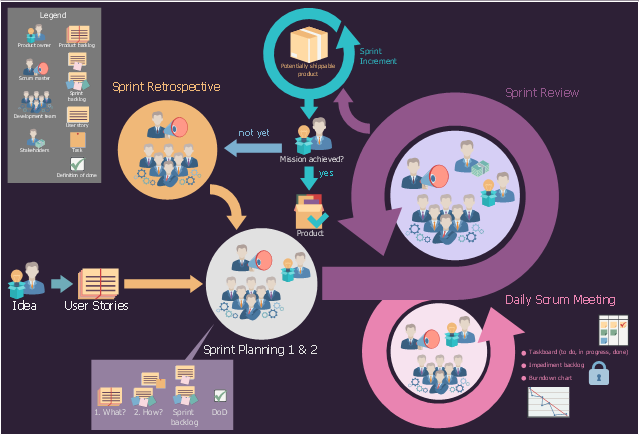
"Scrum: A framework within which people can address complex adaptive problems, while productively and creatively delivering products of the highest possible value. ...
The Scrum framework consists of Scrum Teams and their associated roles, events, artifacts, and rules. Each component within the framework serves a specific purpose and is essential to Scrum’s success and usage.
The rules of Scrum bind together the events, roles, and artifacts, governing the relationships and interaction between them." [scrumguides.org/ scrum-guide.html#definition]
The agile software development infographic sample "Scrum" was created using the ConceptDraw PRO software extended with the Scrum solution from the Project Management area of ConceptDraw Solution Park.
Infographic
How tо Represent Information Graphically

Ice Hockey Positions Diagram

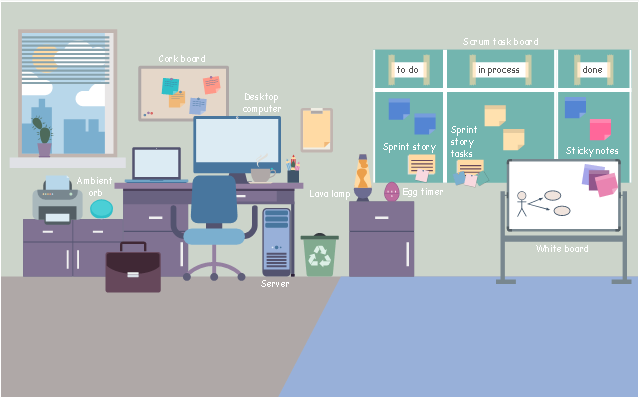
This agile software development infographic example was inspired by Mike Cohn's post "The Ideal Agile Workspace" from the Mountain Goat Software blog.
"... a list of all the things that ... should be visible within the ideal agile workspace:
* Big Visible Charts. ... the sprint burndown chart, showing the number of hours remaining as of each day of the current sprint. ... big visible charts showing the number of passing customer acceptance tests, the pass/ fail status of tests by day, sprint and release burndown charts, number of new stories introduced to the product backlog per sprint ...
* Additional feedback devices. ... a lava lamp that is turned on whenever the automated build is broken. ... flashing red traffic lights to indicate exceptional conditions such as an issue on a production server. ... ambient orbs and Nabaztag rabbits, which are wireless programmable devices that can also be configured to change colors, speak messages, or wiggle their ears as a team desires.
* Everyone on your team. Each person on the team should ideally be able to see each other person on the team. ...
* The sprint backlog. ... The best way to do that is by displaying the sprint backlog on a wall, ideally in the form of a task board A task board is usually oriented in rows and columns with each row containing a particular user story and one index card or sticky note for each task involved in that story. Task cards are organized in columns, minimally including “To Do” “In Process,” and “Done.” ...
* The product backlog. ... tack the index cards with those upcoming user stories on a wall where all can see them. ...
* At least one big white board. ...
* Someplace quiet and private. ...
* Food and drink. ...
* A window." [mountaingoatsoftware.com/ blog/ the-ideal-agile-workspace].
The infographic sample "Scrum workspace" was created using the ConceptDraw PRO software extended with the Scrum solution from the Project Management area of ConceptDraw Solution Park.
Infographic
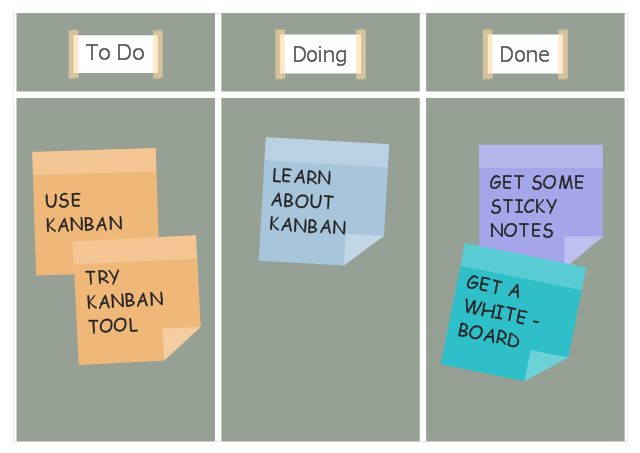
This agile software development infographic example was designed on the base of the Wikimedia Commons file: Simple-kanban-board-.jpg. [commons.wikimedia.org/ wiki/ File:Simple-kanban-board-.jpg]
This file is licensed under the Creative Commons Attribution-Share Alike 3.0 Unported license. [creativecommons.org/ licenses/ by-sa/ 3.0/ deed.en]
"The basic Scrumban board is composed out of three columns: To Do, Doing and Done. After the planning meeting the tasks are added to the To Do column, when a team member is ready to work on a task, he/ she moves it to the Doing column and when he/ she completes it, he/ she moves it to the Done column. The Scrumban board visually represents the progress of the team. The task board columns are adapted and expanded based on the team's work progress. The most common add-ons include priority columns in the To Do section and columns like Design, Manufacturing, Testing in the Doing section." [Scrumban. Wikipedia]
The infographic sample "Scrum board suggesting to use Kanban" was created using the ConceptDraw PRO software extended with the Scrum solution from the Project Management area of ConceptDraw Solution Park.
Infographic
Soccer (Football) Positions
 Positions")
Winter Sports Vector Clipart. Medal Map. Spatial Infographics

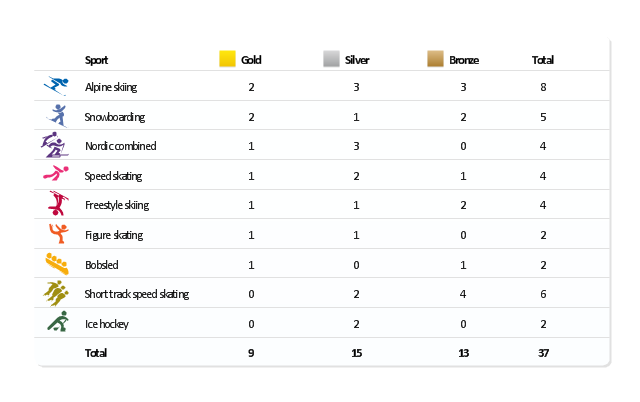
"The United States participated in the 2010 Winter Olympics in Vancouver, British Columbia, Canada. The U.S. team had a historic Winter Games, winning an unprecedented 37 medals. Team USA's medal haul, which included nine gold, marked the first time since the 1932 Lake Placid Games that the U.S. earned more medals than any other participant. ...
The United States finished the 2010 Olympic Games by setting a new record for the most medals won by a single country at a Winter Olympics. The previous record of 36 was set by Germany at the 2002 Winter Olympics; with the silver medal won by the men's hockey team in the final Olympic event of 2010, the U.S. earned their 37th medal of the Vancouver Games. In addition, the U.S. team set a Winter Games record for bronze medals with 13, and the 15 silver medals by the U.S. was second only to the record of 16 set by Germany in 2002." [United States at the 2010 Winter Olympics. Wikipedia]
This medal table example "US at the 2010 Winter Olympics" is created using the ConceptDraw PRO diagramming and vector drawing software extended with the Winter Sports solution.
The Winter Sports solution from the Sport area of ConceptDraw Solution Park contains the vector stencils library "Winter sports pictograms" and examples of diagrams and infographics.
Medal table
Scrum

HelpDesk
How to Create a Release Burn-Down Chart Using ConceptDraw PRO

Basketball Illustrations

- Roles on DAD teams | Create Project Vision | Design elements ...
- Roles on DAD teams | Scrum Workflow | Scrum process work items ...
- Scrum Framework Infographic
- Scrum sprint cycle | Scrum | Scrum workspace | Scrum Infographic
- Roles on DAD teams | Scrum | Design elements - Scrum people ...
- Design elements - Scrum people | Roles on DAD teams | Scrum ...
- Infographics Backlog
- Agile Scrum Infographic
- Stakeholder Infographic
- Scrum Based Development Infographic
- Scrum Master Infographics
- Scrum | Design elements - Scrum people | Stakeholder Onion ...
- Process Flowchart | Design elements - Scrum people | Roles on ...
- Agile Process Scrum Infographic
- Illustration | Exam Preparation Mind Map | What are Infographic Area ...
- Scrum
- Scrum Simple Infographic
- Roles on DAD teams | Value stream with ConceptDraw PRO | Value ...
- Collaboration in a Project Team | Project management - Design ...
- Boss Icon Infographic