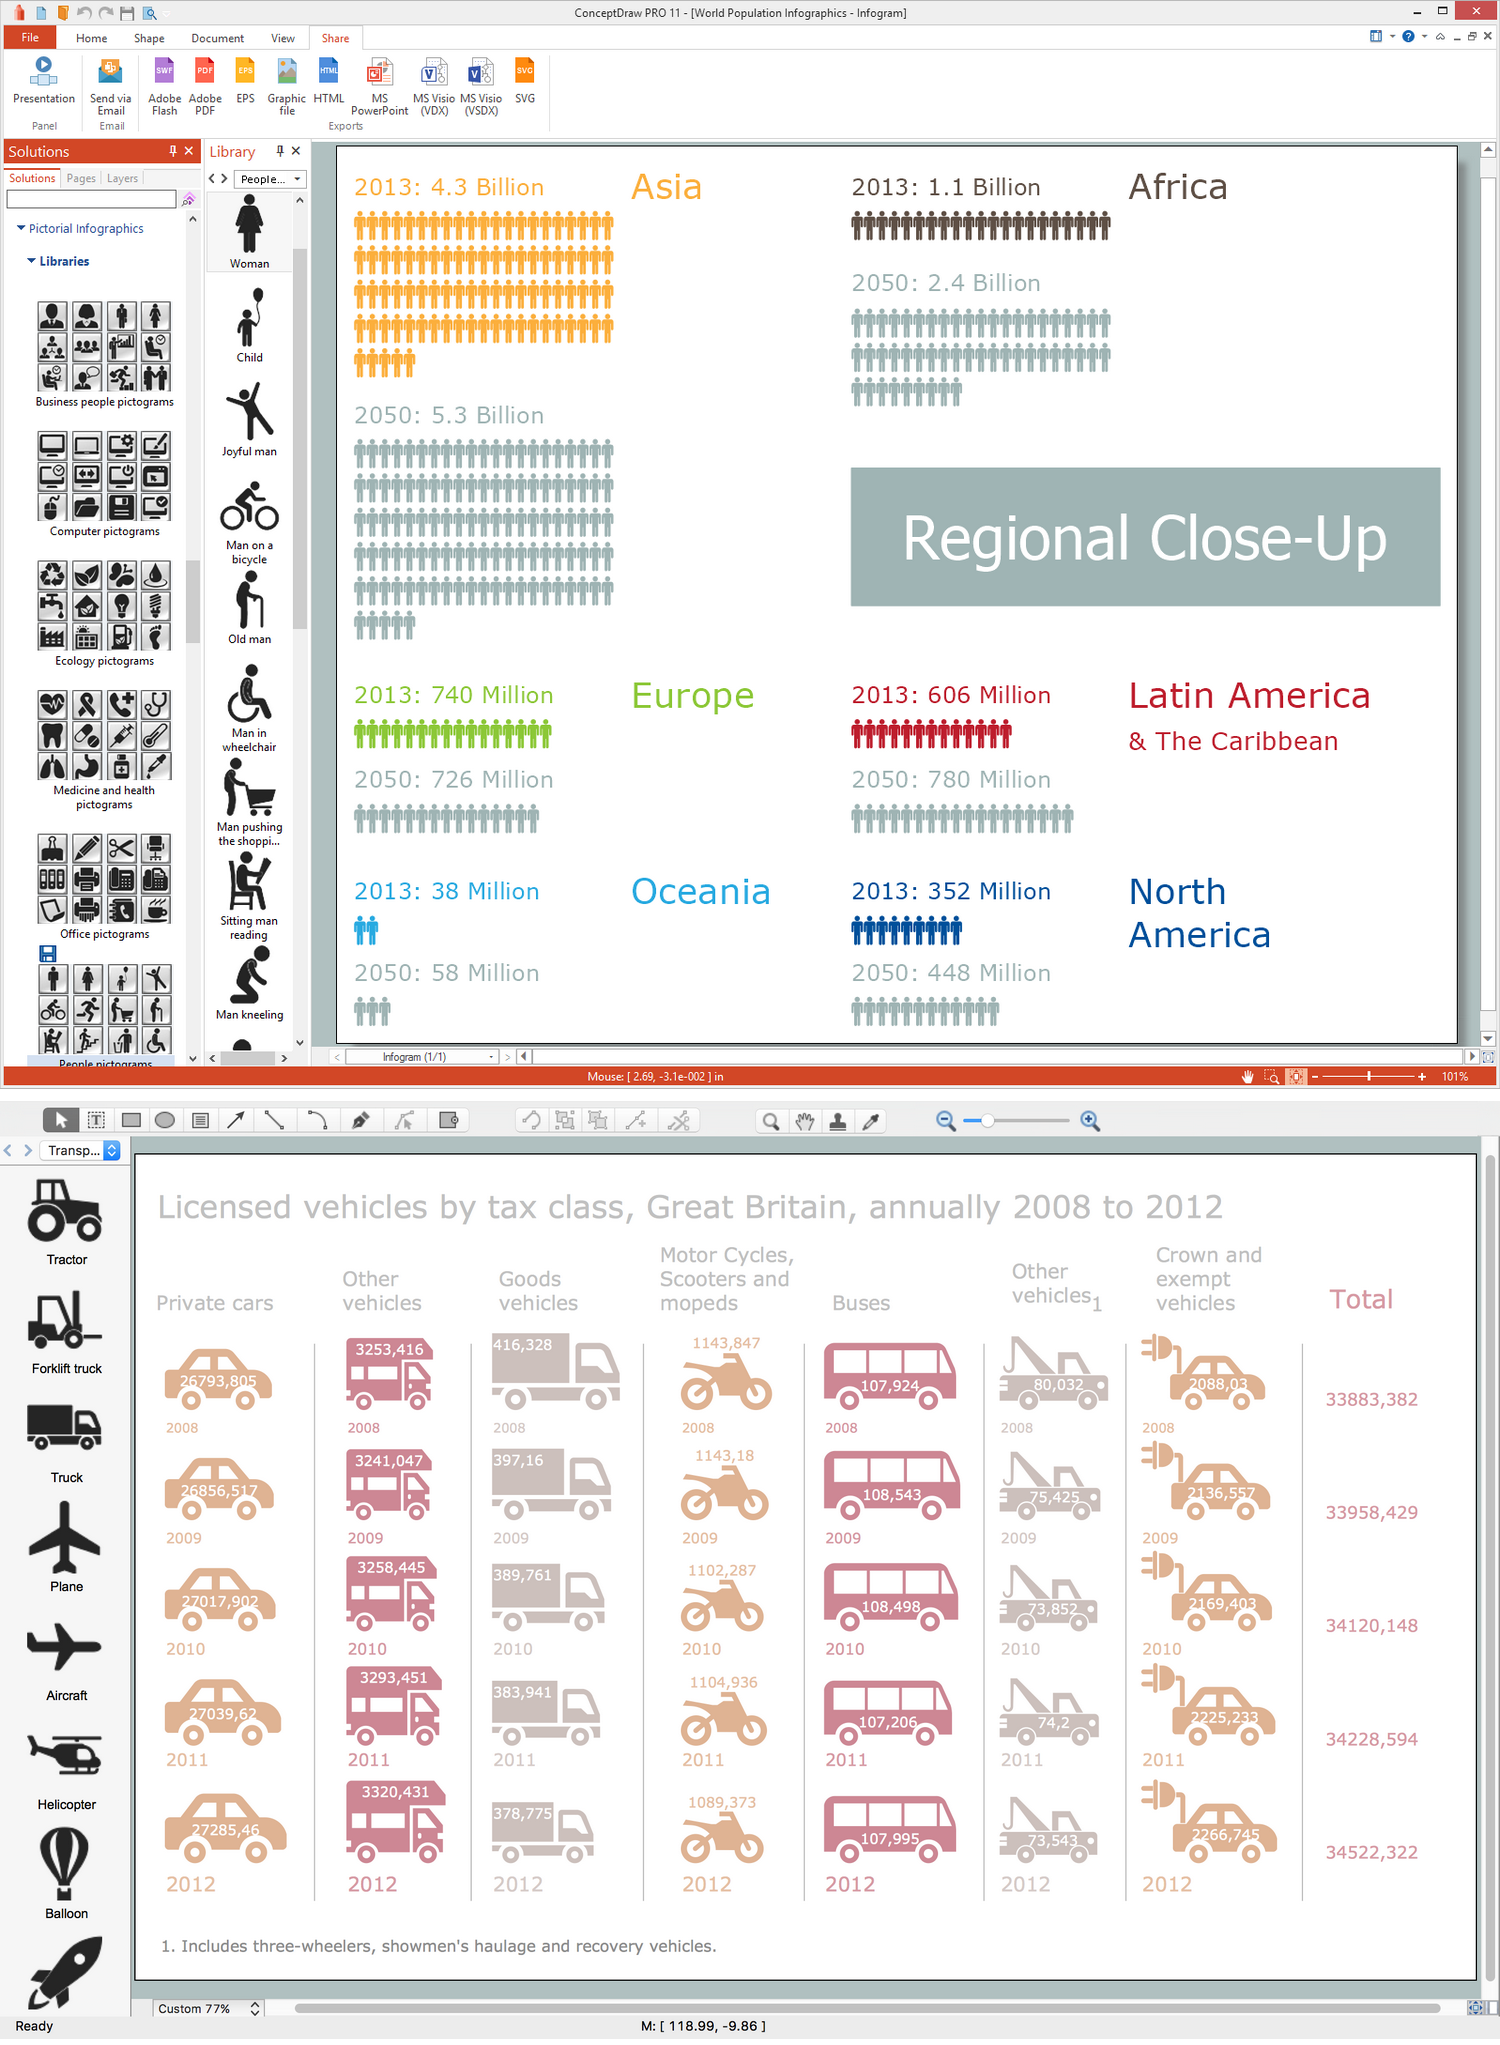
Design Pictorial Infographics. Design Infographics

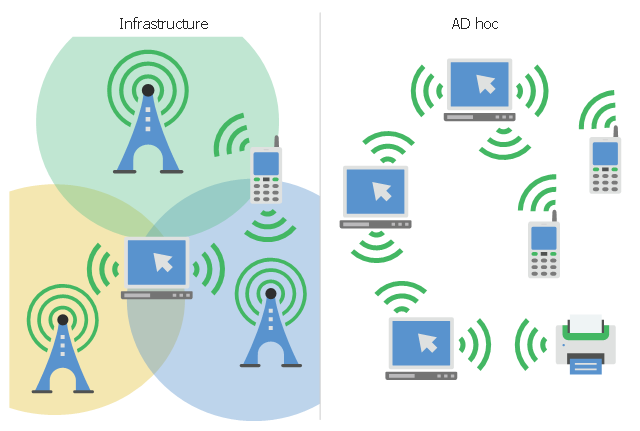
This infographic sample visualizes the Conventional and wireless ad hoc network. It was designed on the base of the Wikimedia Commons file: Běžná bezdrátová síť a ad hoc síť.png.
[commons.wikimedia.org/ wiki/ File:B%C4%9B%C5%BEn%C3%A1_ bezdr%C3%A1tov%C3%A1_ s%C3%AD%C5%A5_ a_ ad_ hoc_ s%C3%AD%C5%A5.png]
This file is licensed under the Creative Commons Attribution-Share Alike 4.0 International license. [creativecommons.org/ licenses/ by-sa/ 4.0/ deed.en]
"A wireless ad hoc network (WANET) is a decentralized type of wireless network. The network is ad hoc because it does not rely on a pre existing infrastructure, such as routers in wired networks or access points in managed (infrastructure) wireless networks. Instead, each node participates in routing by forwarding data for other nodes, so the determination of which nodes forward data is made dynamically on the basis of network connectivity. In addition to the classic routing, ad hoc networks can use flooding for forwarding data.
Wireless mobile ad hoc networks are self-configuring, dynamic networks in which nodes are free to move. Wireless networks lack the complexities of infrastructure setup and administration, enabling devices to create and join networks "on the fly" – anywhere, anytime." [Wireless ad hoc network. Wikipedia]
The infographic example "Conventional and wireless ad hoc network" was created using the ConceptDraw PRO diagramming and vector drawing software extended with the Computers and Communications solution from the Illustration area of ConceptDraw Solution Park.
Network infographic
Infographic Software
 Computer Network Diagrams
Computer Network Diagrams solution extends ConceptDraw DIAGRAM software with samples, templates and libraries of vector icons and objects of computer network devices and network components to help you create professional-looking Computer Network Diagrams, to plan simple home networks and complex computer network configurations for large buildings, to represent their schemes in a comprehensible graphical view, to document computer networks configurations, to depict the interactions between network's components, the used protocols and topologies, to represent physical and logical network structures, to compare visually different topologies and to depict their combinations, to represent in details the network structure with help of schemes, to study and analyze the network configurations, to communicate effectively to engineers, stakeholders and end-users, to track network working and troubleshoot, if necessary.
Export from ConceptDraw DIAGRAM Document to a Graphic File


SWOT Sample in Computers

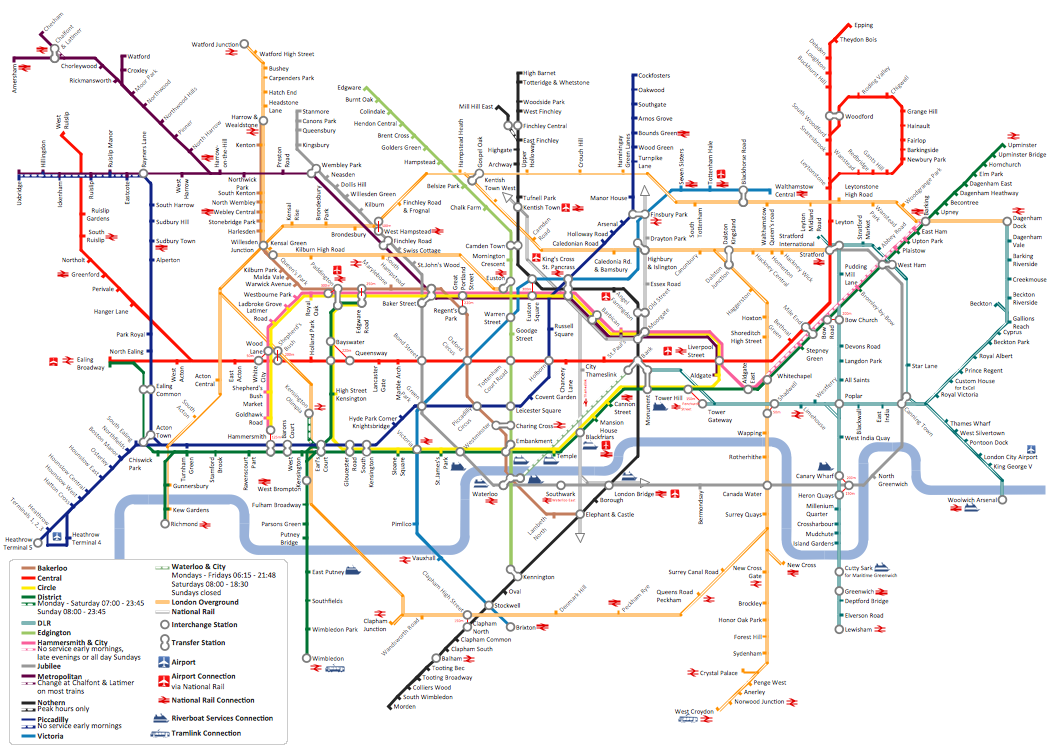
How to draw Metro Map style infographics? (London)
Make an Infographic

- Computer Screen Png Vector Infographic
- Network Server Infographic Set Png
- Computer Network Diagrams | Free Png Man Pictogram
- Multiprotocol Label Switching (MPLS). Computer and Network ...
- Wireless broadband network diagram | Infographic Generator | One ...
- Png Infographic Of Computers
- Travel Hotel Png
- Pc With Tablet Infographic Png
- Network Infographic Png
- Free Tv Infographic Png
- Business Productivity - Marketing | SWOT Sample in Computers ...
- Icons Infographic Png
- City Road Car Png
- Document Folder Infographic Png
- Price Tag Png Images
- How to draw Metro Map style infographics ? Moscow, New York, Los ...
- Pc Computers Vector Png
- Pareto Chart | Best Tool for Infographic Construction | Relative Value ...
- People Gadget Png Vector
- Map Infographic Design | Process Flow Chart | Spatial Infographics ...