The vector stencils library "Controls" contains 53 icons of Windows 8 controls.
Use it to design graphic user interface (GUI) prototypes of your software applications for Windows 8.
"A graphical control element or widget is an element of interaction in a graphical user interface (GUI), such as a button or a scroll bar. Controls are software components that a computer user interacts with through direct manipulation to read or edit information about an application. ...
Each widget facilitates a specific type of user-computer interaction, and appears as a visible part of the application's GUI as defined by the theme and rendered by the rendering engine. The theme makes all graphical control elements adhere to a unified aesthetic design and creates a sense of overall cohesion. Some widgets support interaction with the user, for example labels, buttons, and check boxes. Others act as containers that group the widgets added to them, for example windows, panels, and tabs." [Graphical control element. Wikipedia]
The design elements example "Controls - Vector stencils library" was created using the ConceptDraw PRO diagramming and vector drawing software extended with the Windows 8 User Interface solution from the Software Development area of ConceptDraw Solution Park.
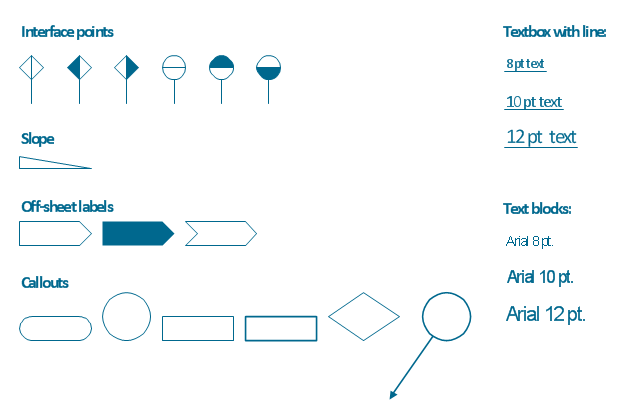
The vector stencils library "Process annotations" contains 22 symbols of interface points, slope, off-sheet labels, callouts and textboxes.
Use these shapes for setting automatic labels to display a datasheet field for a pipeline shape, labels, captions, outlines, off-sheet labels, text balloons, annotations, outlines, tags, and descriptions.
"In engineering a process is a set of interrelated tasks that, together, transform inputs into outputs. These tasks may be carried out by people, nature, or machines using resources; so an engineering process must be considered in the context of the agents carrying out the tasks, and the resource attributes involved. Systems Engineering normative documents and those related to Maturity Models are typically based on processes. For example, System Engineering processes of the EIA-632 and processes involved in the Capability Maturity Model Integration (CMMI) institutionalization and improvement approach. Constraints imposed on the tasks and resources required to implement them are essential for executing the tasks mentioned.
A chemical process is a series of unit operations used to produce a material in large quantities.
In the chemical industry, chemical engineers will use the following to define or illustrate a process:
Process Flow Diagram (PFD),
Piping and instrumentation diagram
(P&ID),
Simplified process description,
Detailed process description,
Project management,
Process simulation." [Process (engineering). Wikipedia]
The example "Design elements - Process annotations" was created using the ConceptDraw PRO diagramming and vector drawing software extended with the Chemical and Process Engineering solution from the Engineering area of ConceptDraw Solution Park.
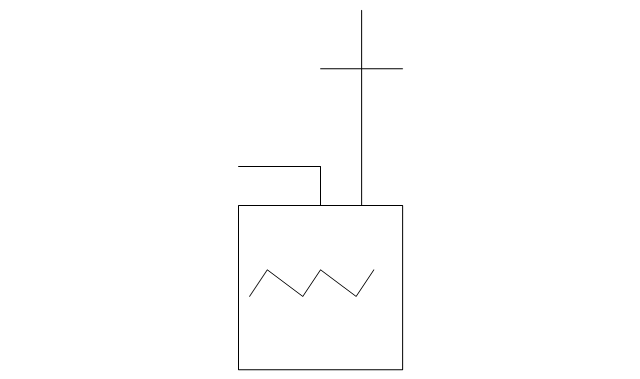
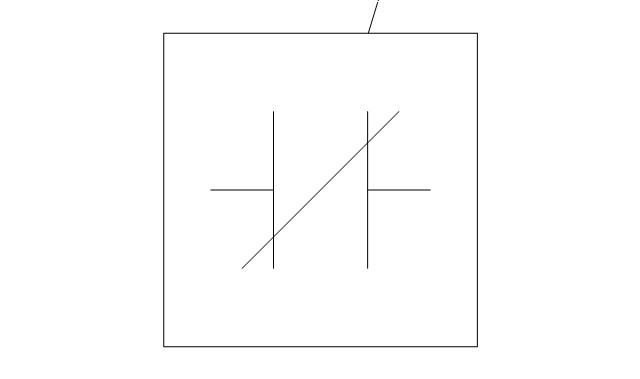
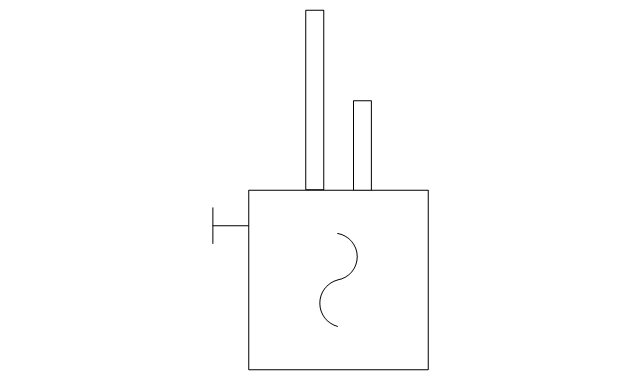
The vector stencils library "HVAC controls" contains 23 symbols of HVAC controls (sensors, actuators, timers, controllers, I/ O points). Use it for drawing HVAC system diagrams, controls drawings, and automated building control and environmental control systems design. The example "HVAC controls - Vector stencils library" was created using the ConceptDraw PRO diagramming and vector drawing software extended with the HVAC Plans solution from the Building Plans area of ConceptDraw Solution Park.
The vector stencils library "Marketing" contains 30 marketing icons.
Use it to design your business and finance illustrations and infographics with ConceptDraw PRO diagramming and vector drawing software.
The vector stencils library "Marketing" is included in the Business and Finance solution from the Illustration area of ConceptDraw Solution Park.
Use it to design your business and finance illustrations and infographics with ConceptDraw PRO diagramming and vector drawing software.
The vector stencils library "Marketing" is included in the Business and Finance solution from the Illustration area of ConceptDraw Solution Park.
"A chart can take a large variety of forms, however there are common features that provide the chart with its ability to extract meaning from data.
Typically the data in a chart is represented graphically, since humans are generally able to infer meaning from pictures quicker than from text. Text is generally used only to annotate the data.
One of the more important uses of text in a graph is the title. A graph's title usually appears above the main graphic and provides a succinct description of what the data in the graph refers to.
Dimensions in the data are often displayed on axes. If a horizontal and a vertical axis are used, they are usually referred to as the x-axis and y-axis respectively. Each axis will have a scale, denoted by periodic graduations and usually accompanied by numerical or categorical indications. Each axis will typically also have a label displayed outside or beside it, briefly describing the dimension represented. If the scale is numerical, the label will often be suffixed with the unit of that scale in parentheses. ...
Within the graph a grid of lines may appear to aid in the visual alignment of data. The grid can be enhanced by visually emphasizing the lines at regular or significant graduations. The emphasized lines are then called major grid lines and the remainder are minor grid lines.
The data of a chart can appear in all manner of formats, and may include individual textual labels describing the datum associated with the indicated position in the chart. The data may appear as dots or shapes, connected or unconnected, and in any combination of colors and patterns. Inferences or points of interest can be overlaid directly on the graph to further aid information extraction.
When the data appearing in a chart contains multiple variables, the chart may include a legend (also known as a key). A legend contains a list of the variables appearing in the chart and an example of their appearance. This information allows the data from each variable to be identified in the chart." [Chart. Wikipedia]
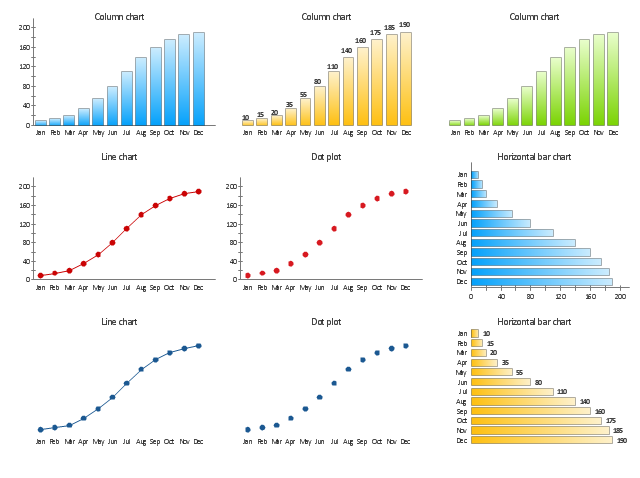
The vector stencils library "Time series charts" contains 10 templates: 3 column charts, 3 bar charts, 2 line graphs and 2 dot plots. All these charts are Live Objects displaying the data from external data source files.
Use these chart templates to design your business performance digital dashboards using the ConceptDraw PRO diagramming and vector drawing software.
The example "Design elements - Time series charts" is included in the Time Series Dashboard solution from the area "What is a Dashboard" of ConceptDraw Solution Park.
- Label Vector Png
- Controls - Vector stencils library | Interior Design Office Layout Plan ...
- Sample Product Label Design Png
- iPhone interface - Vector stencils library | iPhone interface - Vector ...
- Nail Vector Png
- Png Rectangle Designs
- MS Windows Vista user interface - Vector stencils library | Design ...
- New Style Png
- Vector Label Tag Png
- Design elements - Callouts | Design elements - Education titled ...
- Png Text Box Design
- Rectangle Design Png
- Hexagon Design Png
- Labels Lines Png
- Computer Switch Image Png
- How to Draw a Landscape Design Plan | Landscape & Garden ...
- Apple Wireless Mouse | Marketing - Vector stencils library | Design ...
- Global networks - Vector stencils library | Unified communications ...
- Office Design Element | Computer Network Architecture. Computer ...


