Process Flowchart


This SWOT matrix diagram example was created on the base of article "An Easy Way To Jumpstart Your Strategic Plan: SWOT" by Leslie Wolf from the website of the California Digital Library, the University of California. "Strategic planning doesn’t have to be a daunting and lengthy process. The goal is really a simple one: to help you understand your world and build a road map to guide your efforts. ...
This analysis tool can help you focus your attention on the specific success factors that are right for your team.
The tool is called a SWOT analysis. SWOT stands for Strengths and Weaknesses, Opportunities and Threats. Here’s what it means:
(1) Strengths are those positive internal attributes that strengthen your business or team. You can develop plans to capitalize on those strengths.
(2) Weaknesses are those negative internal attributes that are working against your success. You can shore up those weaknesses so they don’t stop your success.
(3) Opportunities are those external conditions that can have a positive effect on your goals. These opportunities can point you in the right direction.
(4) Threats are those external conditions that can have a negative effect on your goals. These threats will affect you less if you can identify and minimize them. ...
We thought it would be helpful to show you a sample SWOT analysis for a business you can easily visualize: a small independent bookstore in a university town. The store owner brought the team together to think about how the bookstore could survive during the continuing financial downturn. After an hour of brainstorming, this is the SWOT analysis they developed." [cdlib.org/ cdlinfo/ 2010/ 09/ 29/ an-easy-way-to-jumpstart-your-strategic-plan-swot/ ]
The matrix diagram example "SWOT analysis for a small independent bookstore" was created using the ConceptDraw PRO diagramming and vector drawing software extended with the SWOT Analysis solution from the Management area of ConceptDraw Solution Park.
SWOT matrix

Material Requisition Flowchart. Flowchart Examples

When To Use a Fishbone Diagram

F&B

Cause and Effect Diagrams

The vector stencils library "Workflow diagrams" contains 54 symbol icons of workflow diagrams.
The workflow diagrams represent information flow, automation of business processes, business process re-engineering, accounting, management, and human resources tasks in industry, business, and manufacturing.
Use this library to draw workflow diagrams in the ConceptDraw PRO diagramming and vector drawing software extended with the Workflow Diagrams solution from the Business Processes area of ConceptDraw Solution Park.
www.conceptdraw.com/ solution-park/ business-process-workflow-diagrams
Accounting

Accounts Payable

Accounts Receivable

Bank

Board of Directors

Copy Center

Customer Service

Distribution

Finance

Information Systems

International Division

International Marketing

International Sales

Inventory

Legal Department

Mailroom 2

Mailroom 1

Management

Manufacturing

Marketing

Motor Pool

Packaging

Payroll

Person 1

Person 2

Personnel/ Staff

Publications

Purchasing

Quality Assurance

Exchange

Reception

Research and Development

Sale contract

Shipping

Suppliers

Telecommunications

Treasurer

Warehouse

Lorry

Quality

Production

Box

Boxes

Open box

Payment

Receiving

Sales

Phone

Operator 1

Online booking

Operator 2

Server

Car

Mini truck

Why People Select ConceptDraw MINDMAP

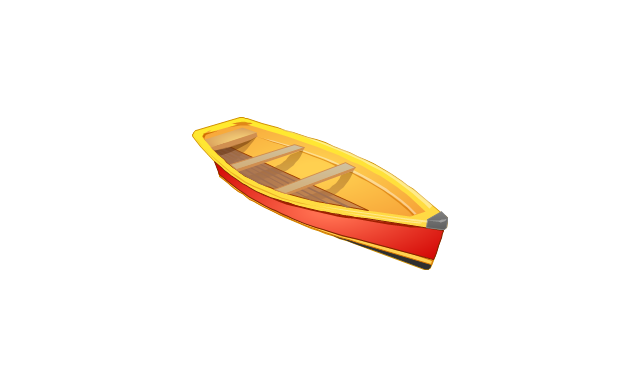
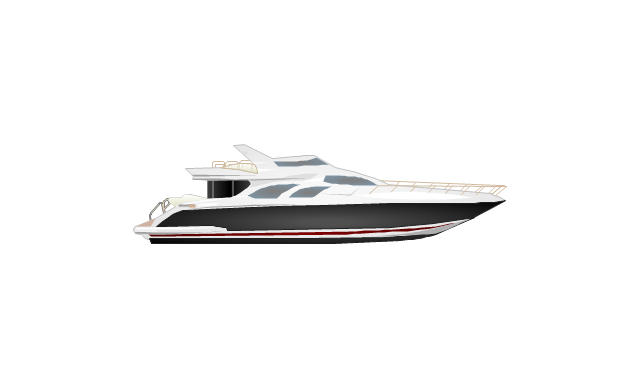
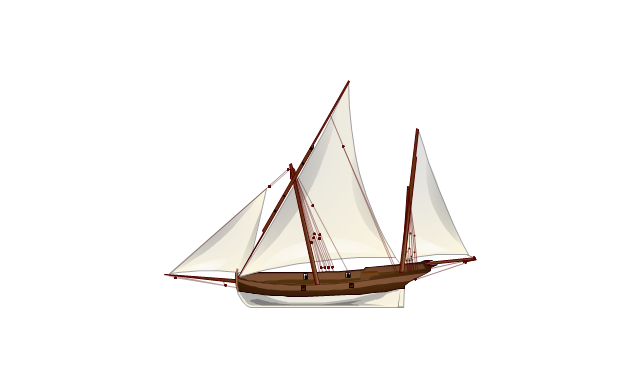
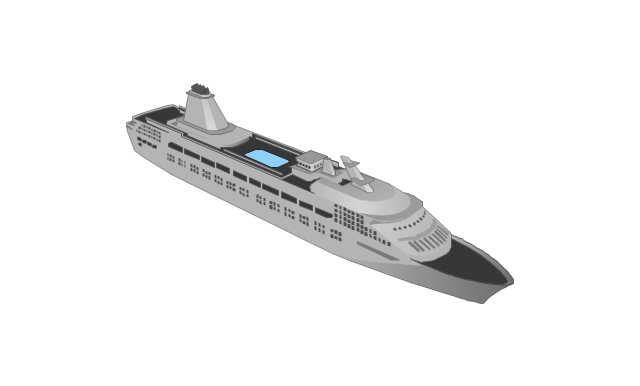
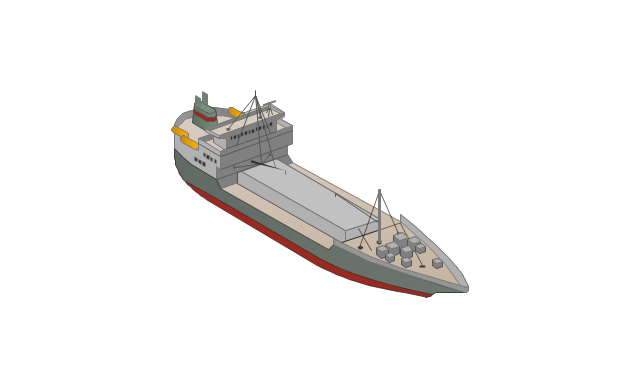
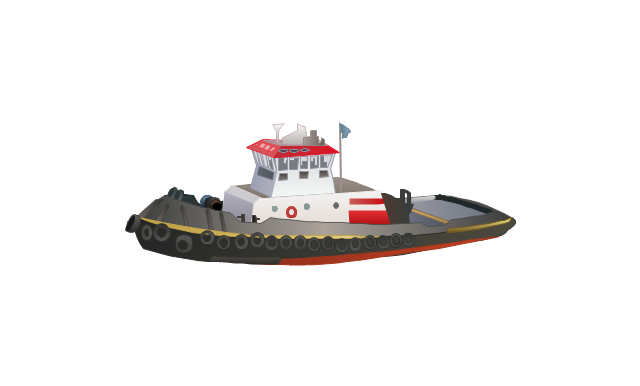
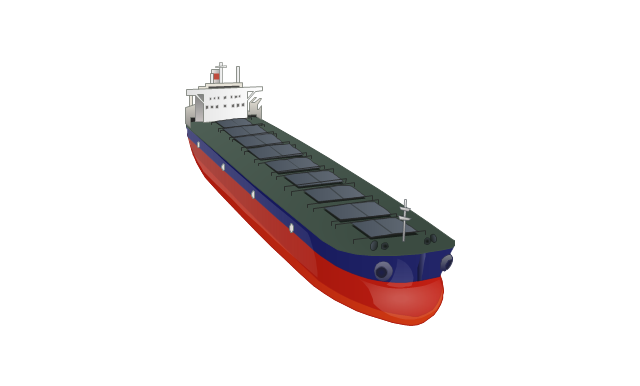
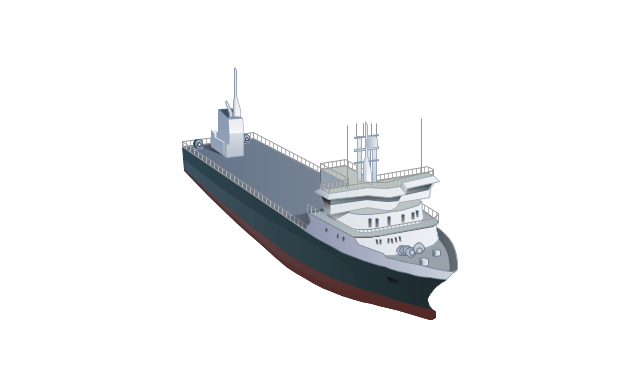
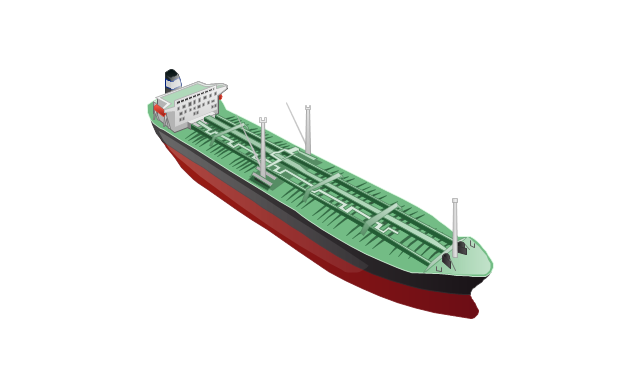
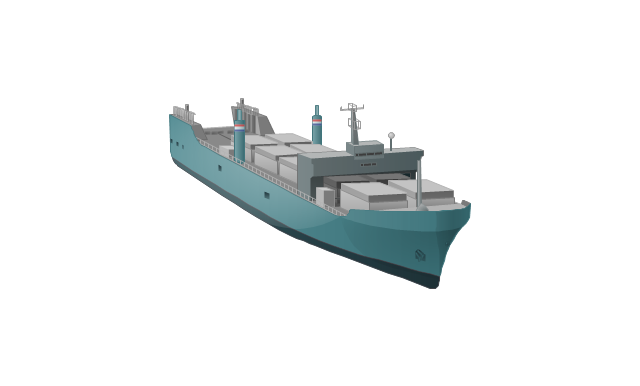
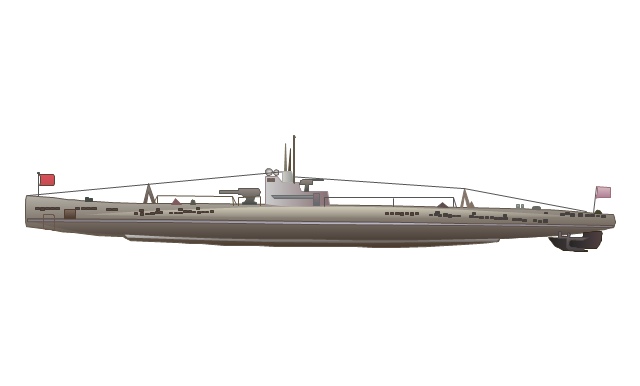
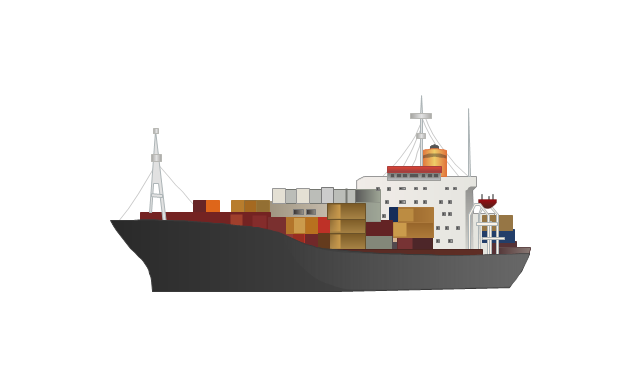
The vector stencils library "Watercraft" contains 28 clip art images for creating ship transport illustrations, presentation slides, infographics and webpages using the ConceptDraw PRO diagramming and vector drawing software.
"The term watercraft covers a range of different vehicles including ships, boats, hovercraft and submarines, and differs from a simple device that merely floats, such as a log raft. ...
Usually the purposes behind watercraft designs and skills are for seafaring education or leisure activities, fishing and resource extraction, transportation of cargo or passengers, and for conducting combat or salvage operations. In general, the purpose of a water vehicle identifies its utility with a maritime industry sub-sector." [Watercraft. Wikipedia]
The vector stencils library "Watercraft" is included in the Aerospace and Transport solution from the Illustrations area of ConceptDraw Solution Park.
www.conceptdraw.com/ solution-park/ illustrations-aerospace-transport
Boat
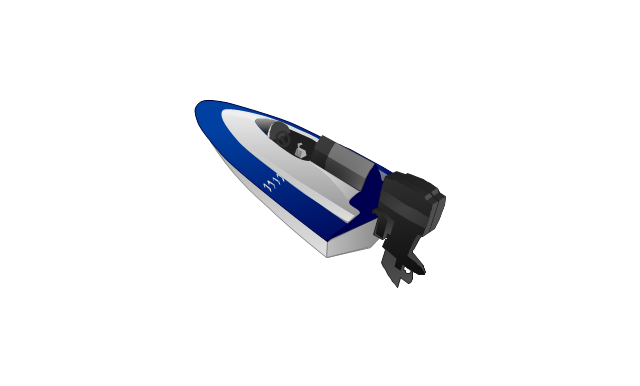
Motorboat
Yacht
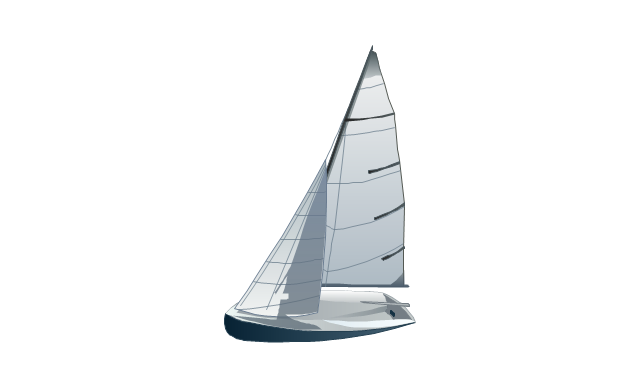
Sailing yacht
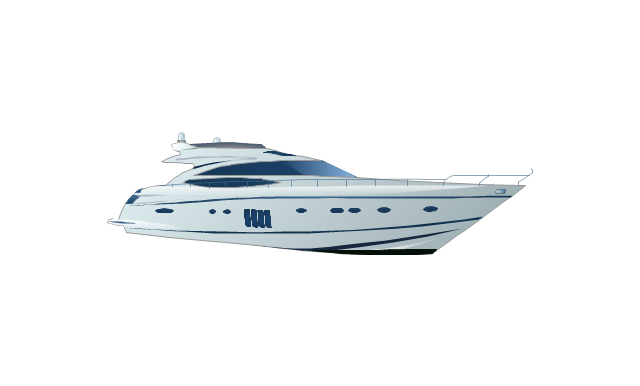
Motor yacht
Passenger vessel

Sailing ship
Passenger ship
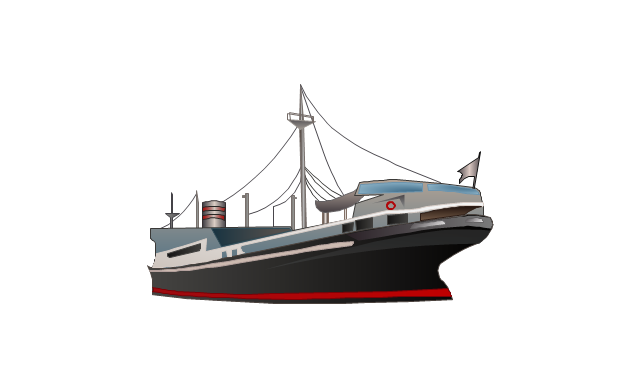
Regular ship
Tugboat
Oil ship
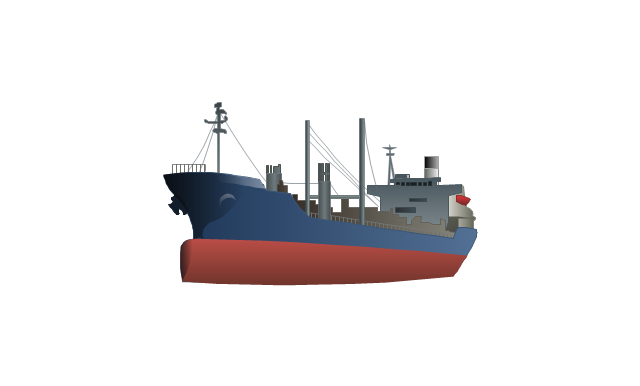
Dry cargo ship
Dry cargo vessel
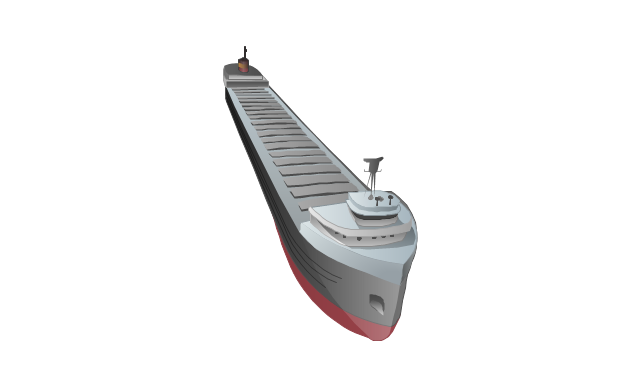
Capesize bulk-carrier
Handysize bulk-carrier
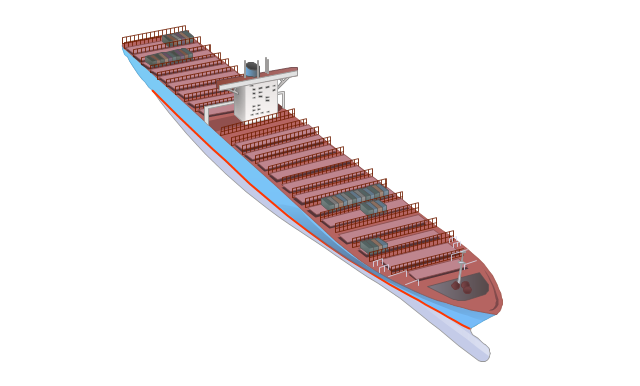
Container ship
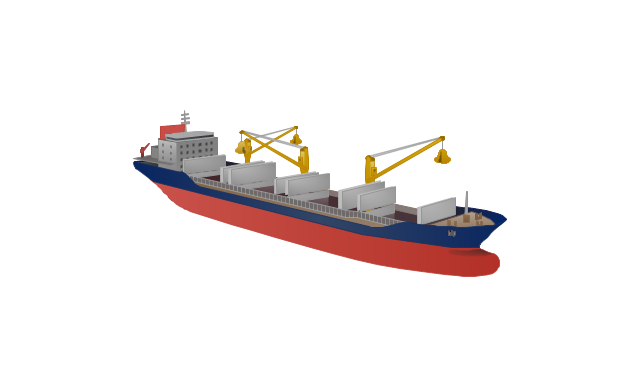
Multipurpose ship
Reefer
Oil tanker
Reefer vessel
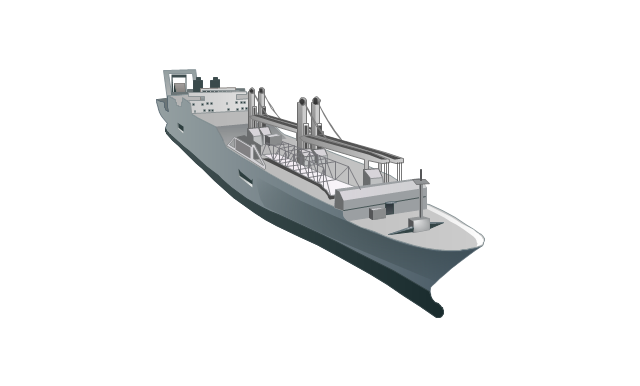
Gas ship
Lighter aboard ship
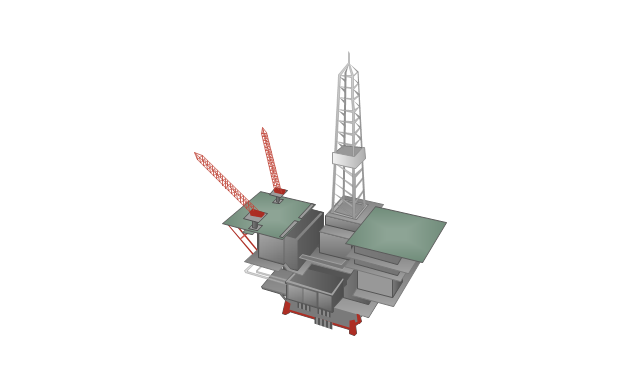
Offshore oil platform
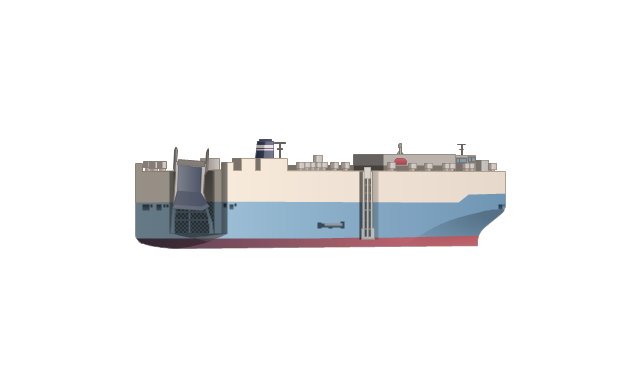
Car carrier
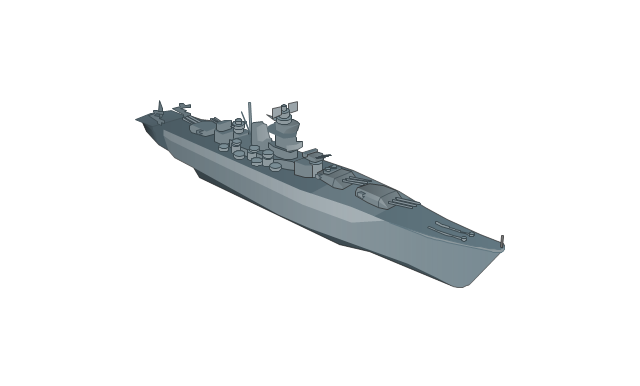
Battleship
Submarine
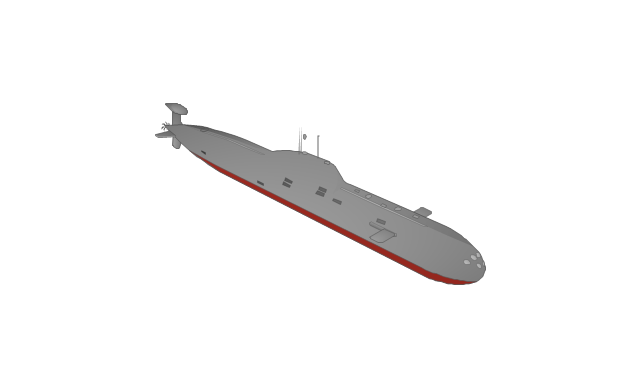
Submarine
Container ship
Basic Diagramming


Fishbone Diagram Template

This example shows fast food bar: customers paying and taking their orders at the counter, cashiers at the cash registers, menu boards over the counter, man and woman carrying their trays with food and beverages, man sitting at the table and eating his meal.
"A fast food restaurant, also known as a quick service restaurant (QSR) within the industry, is a specific type of restaurant characterized both by its fast food cuisine and by minimal table service. Food served in fast food restaurants typically caters to a "meat-sweet diet" and is offered from a limited menu; is cooked in bulk in advance and kept hot; is finished and packaged to order; and is usually available ready to take away, though seating may be provided. Fast food restaurants are typically part of a restaurant chain or franchise operation, which provisions standardized ingredients and/ or partially prepared foods and supplies to each restaurant through controlled supply channels." [en.wikipedia.org/ wiki/ Fast_ food_ restaurant]
The food court illustration example "Fast food bar" was drawn using the ConceptDraw PRO diagramming and vector drawing software extended with the Food Court solution from the Food and Beverages area of ConceptDraw Solution Park.
Food court illustration

IDEF0 Flowchart Symbols

Food Court

Network Security Diagram

- Industry Motor Symbol Animation
- Industrial Building Animated
- Restaurant Floor Plans Samples | F&B | Food Court | Example ...
- Food Court | F&B | Fast food bar | Fast Food Menu Animation
- Process Flowchart | Matrix Organization Structure | Basic Audit ...
- Operation Process Chart Industrial Engineering
- Basic Flowchart Symbols and Meaning | Process Flowchart ...
- Animated Process Flow Diagram
- Basic Flowchart Symbols and Meaning | Process Flowchart | Flow ...
- Watercraft - Design Elements | Watercraft - Vector stencils library ...
- Human Resource Animation
- Manufacturing and Maintenance | Presentation Clipart | Holiday ...
- Process Flowchart | Material Requisition Flowchart. Flowchart ...
- Watercraft - Design Elements | Watercraft - Vector stencils library ...
- Flowchart Marketing Process. Flowchart Examples | Marketing Flow ...
- Diagramming Software for Design UML Timing Diagrams | Timing ...
- Telecommunication Network Diagrams | Telecommunication ...
- Types of Welding in Flowchart | Butt weld geometry | IDEF9 ...
- Create a Presentation Using a Design Template | Sequence ...
- UML Block Diagram | Block Diagrams | How to Draw a Block ...