HelpDesk
How to Draw a Circular Arrows Diagram

The vector clipart library "Presentation design elements" contains 45 presentation symbols and arrows which you can easy use in your slides and illustrations.
"A presentation is the process of presenting a topic to an audience. It is typically a demonstration, lecture, or speech meant to inform, persuade, or build good will. ... the use of visuals reduced meeting times... audiences believe presenters who use visuals are more professional and credible than presenters who merely speak. ... meetings and presentations reinforced with visuals help participants reach decisions and consensus more quickly." [Presentation. Wikipedia]
The clip art example "Presentation design elements - Vector clipart library" was created in the ConceptDraw PRO diagramming and vector drawing software using the Presentation Clipart solution from the Illustration area of ConceptDraw Solution Park.
Advance Direction Sign

Circuit

Growth

Master Link

Comparison

Plus

Minus

Multiplication

Division

Loupe

Plus sign

Minus sign

Pros and Cons

Balance Lever

Balance

Scientific Research

Business People

Hand

Financial Growth

Wallet

Increase

Decrease

Clock

Mechanism

Interaction

Small Company

Big Company

Company Expansion

Foreign Market Entry

Time

Close Cooperation

Company

Company Merger

Company Extension

Foreign Market Penetration

Business Relations

Profits

Frame 1

Frame 2

Background 1

Background 2

Background 3

Background 4

Background 5

Title block

The vector clipart library "Presentation design elements" contains 45 presentation symbols and arrows which you can easy use in your slides and illustrations.
"A presentation is the process of presenting a topic to an audience. It is typically a demonstration, lecture, or speech meant to inform, persuade, or build good will. ... the use of visuals reduced meeting times... audiences believe presenters who use visuals are more professional and credible than presenters who merely speak. ... meetings and presentations reinforced with visuals help participants reach decisions and consensus more quickly." [Presentation. Wikipedia]
The clip art example "Presentation design elements - Vector clipart library" was created in the ConceptDraw PRO diagramming and vector drawing software using the Presentation Clipart solution from the Illustration area of ConceptDraw Solution Park.
"A presentation is the process of presenting a topic to an audience. It is typically a demonstration, lecture, or speech meant to inform, persuade, or build good will. ... the use of visuals reduced meeting times... audiences believe presenters who use visuals are more professional and credible than presenters who merely speak. ... meetings and presentations reinforced with visuals help participants reach decisions and consensus more quickly." [Presentation. Wikipedia]
The clip art example "Presentation design elements - Vector clipart library" was created in the ConceptDraw PRO diagramming and vector drawing software using the Presentation Clipart solution from the Illustration area of ConceptDraw Solution Park.
Advance Direction Sign
Circuit
Growth
Master Link
Comparison
Plus
Minus
Multiplication
Division
Loupe
Plus sign
Minus sign
Pros and Cons
Balance Lever
Balance
Scientific Research
Business People
Hand
Financial Growth
Wallet
Increase
Decrease
Clock
Mechanism
Interaction
Small Company
Big Company
Company Expansion
Foreign Market Entry
Time
Close Cooperation
Company
Company Merger
Company Extension
Foreign Market Penetration
Business Relations
Profits
Frame 1
Frame 2
Background 1
Background 2
Background 3
Background 4
Background 5
Title block
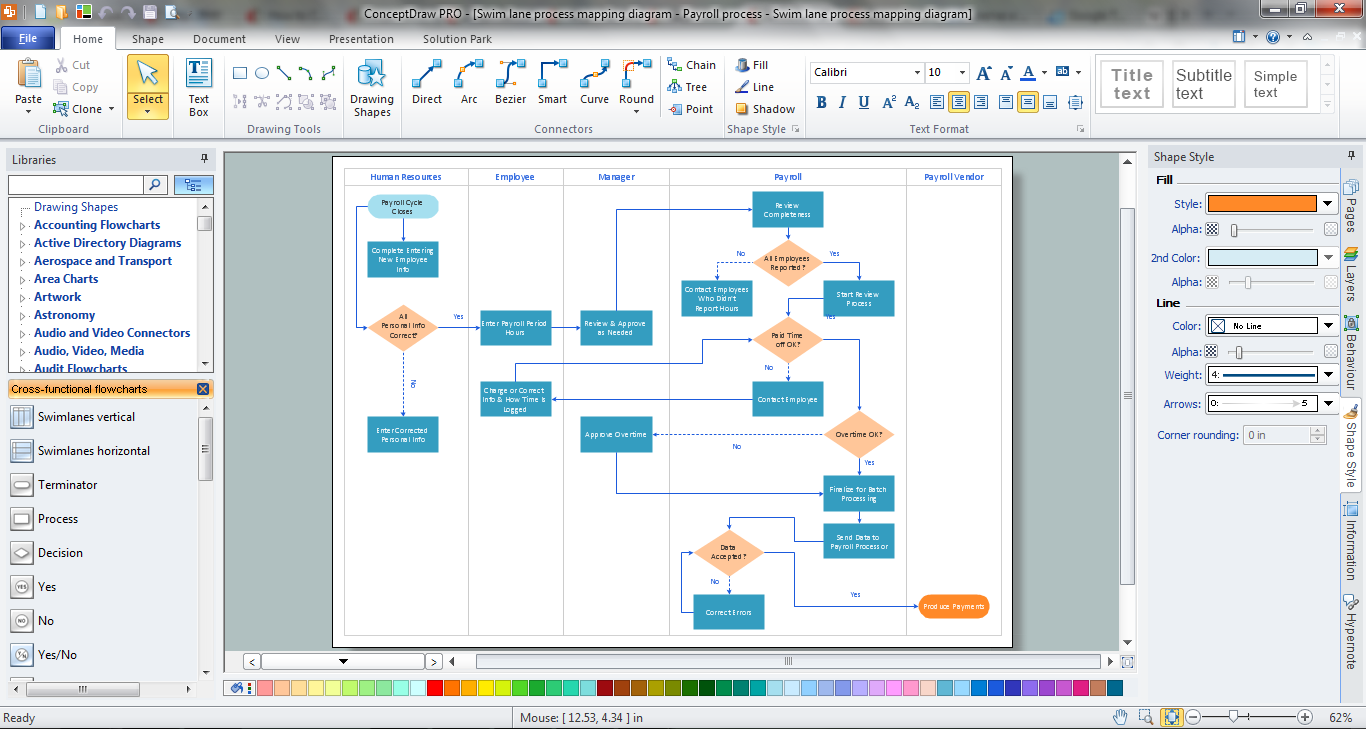
Cross Functional Flowchart
HelpDesk
How to Create the Custom Diagram Template
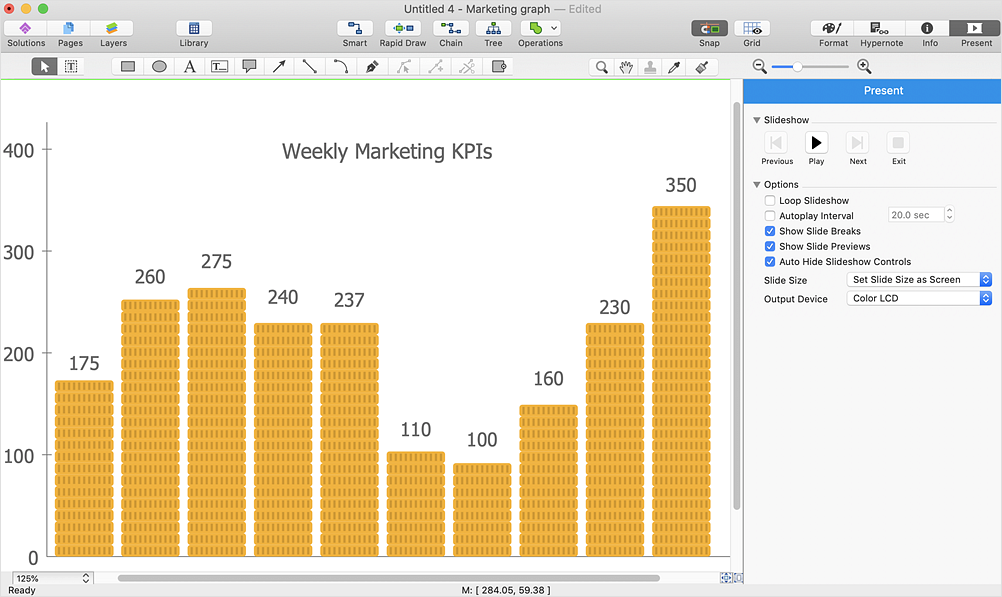
A picture chart (image chart, pictorial graph) is the type of a bar graph visualizing numarical data using symbols and pictograms.
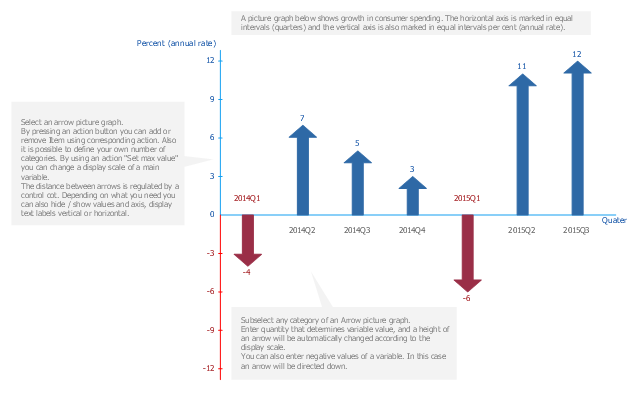
In the field of economics and finance use a picture graph with columns in the form of coins. For population comparison statistics use a chart with columns in the form of manikins. To show data increase or decrease use arrows bar charts.
The arrow chart template "Picture graph" for the ConceptDraw PRO diagramming and vector drawing software is included in the Basic Picture Graphs solution from the Graphs and Charts area of ConceptDraw Solution Park.
Arrows bar graph template
The vector clipart library "Presentation design elements" contains 45 presentation symbols and arrows which you can easy use in your slides and illustrations.
"A presentation is the process of presenting a topic to an audience. It is typically a demonstration, lecture, or speech meant to inform, persuade, or build good will. ... the use of visuals reduced meeting times... audiences believe presenters who use visuals are more professional and credible than presenters who merely speak. ... meetings and presentations reinforced with visuals help participants reach decisions and consensus more quickly." [Presentation. Wikipedia]
The clip art example "Presentation design elements - Vector clipart library" was created in the ConceptDraw PRO diagramming and vector drawing software using the Presentation Clipart solution from the Illustration area of ConceptDraw Solution Park.
"A presentation is the process of presenting a topic to an audience. It is typically a demonstration, lecture, or speech meant to inform, persuade, or build good will. ... the use of visuals reduced meeting times... audiences believe presenters who use visuals are more professional and credible than presenters who merely speak. ... meetings and presentations reinforced with visuals help participants reach decisions and consensus more quickly." [Presentation. Wikipedia]
The clip art example "Presentation design elements - Vector clipart library" was created in the ConceptDraw PRO diagramming and vector drawing software using the Presentation Clipart solution from the Illustration area of ConceptDraw Solution Park.
Advance Direction Sign
Circuit
Growth
Master Link
Comparison
Plus
Minus
Multiplication
Division
Loupe
Plus sign
Minus sign
Pros and Cons
Balance Lever
Balance
Scientific Research
Business People
Hand
Financial Growth
Wallet
Increase
Decrease
Clock
Mechanism
Interaction
Small Company
Big Company
Company Expansion
Foreign Market Entry
Time
Close Cooperation
Company
Company Merger
Company Extension
Foreign Market Penetration
Business Relations
Profits
Frame 1
Frame 2
Background 1
Background 2
Background 3
Background 4
Background 5
Title block
Hiring Process

Entity Relationship Diagram Symbols

HelpDesk
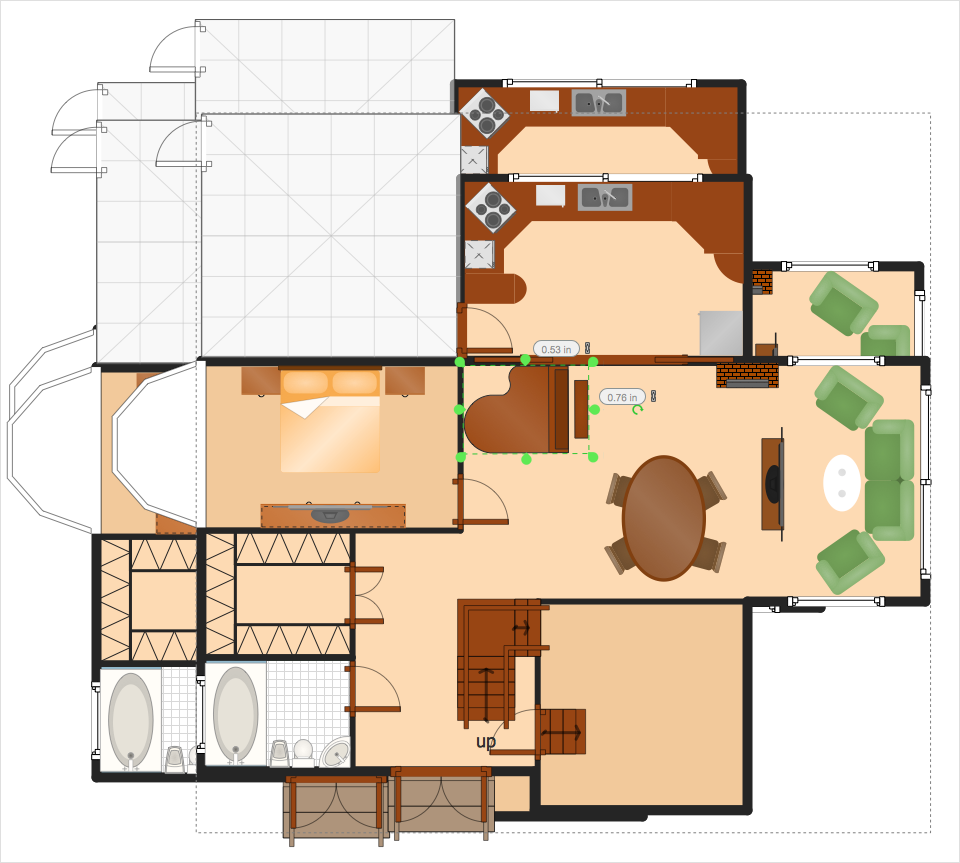
How to Resize Objects
- Arrows - Vector clipart library | HR arrows - Vector stencils library ...
- Arrows - Vector clipart library | Design elements - Arrows ...
- Arrow Up Png
- Presentation Clipart | Arrows - Vector clipart library | Winter Sports ...
- Presentation Clipart | Presentation design elements - Vector clipart ...
- Arrows - Vector clipart library | Presentation Clipart | Circular Arrows ...
- Up Arrow Design
- Arrows - Vector clipart library | Presentation Clipart | IDEF0 standard ...
- HR arrows - Vector stencils library | Sales arrows - Vector stencils ...
- Progressive disclosure controls - Vector stencils library | Glyph icons ...