Basic Flowchart Symbols and Meaning


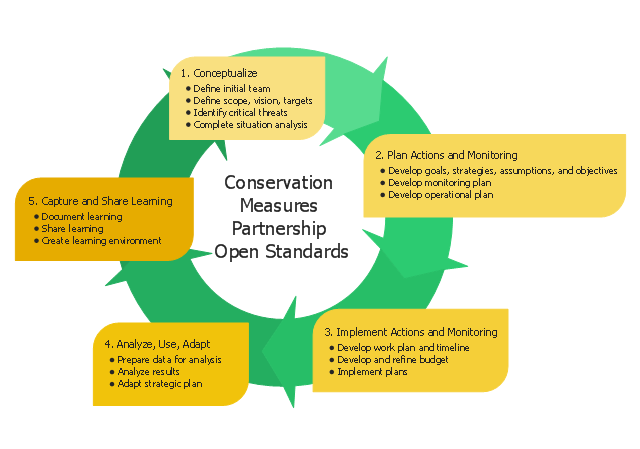
This circular arrows diagram sample shows five steps of the Conservation Measures Partnership (CMP) adaptive management cycle. It was designed on the base of the Wikimedia Commons file: CMP Cycle - 2008-02-20.jpg.
[commons.wikimedia.org/ wiki/ File:CMP_ Cycle_ -_ 2008-02-20.jpg]
"Adaptive management (AM), also known as adaptive resource management (ARM), is a structured, iterative process of robust decision making in the face of uncertainty, with an aim to reducing uncertainty over time via system monitoring. In this way, decision making simultaneously meets one or more resource management objectives and, either passively or actively, accrues information needed to improve future management. Adaptive management is a tool which should be used not only to change a system, but also to learn about the system. Because adaptive management is based on a learning process, it improves long-run management outcomes. The challenge in using the adaptive management approach lies in finding the correct balance between gaining knowledge to improve management in the future and achieving the best short-term outcome based on current knowledge.
Application to environmental projects and programs.
Open Standards for the Practice of Conservation lay out 5 main steps to an adaptive management project cycle." [Adaptive management. Wikipedia]
The diagram example "CMP adaptive management cycle" was created using the ConceptDraw PRO diagramming and vector drawing software extended with the Circular Arrows Diagrams solution from the area "What is a Diagram" of ConceptDraw Solution Park.
Circular arrows diagram
Used Solutions
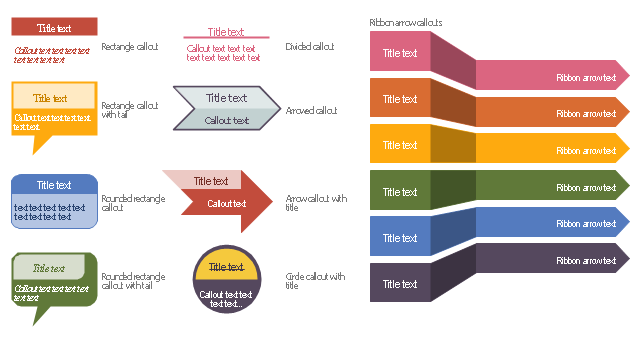
The vector stencils library "Education titled callouts" contains 14 titled callout blocks.
Use it to design your educational infograms.
"In publishing, a call-out or callout is a short string of text connected by a line, arrow, or similar graphic to a feature of an illustration or technical drawing, and giving information about that feature. The term is also used to describe a short piece of text set in larger type than the rest of the page and intended to attract attention.
A similar device in word processing is a special text box with or without a small "tail" that can be pointed to different locations on a document." [Callout. Wikipedia]
The shapes example "Design elements - Education titled callouts" was created using the ConceptDraw PRO diagramming and vector drawing software extended with the Education Infographics solition from the area "Business Infographics" in ConceptDraw Solution Park.
Titled callout blocks
Concept Maps

 Circle-Spoke Diagrams
Examples of subject areas that are well suited to this approach are marketing, business, products promotion, process modeling, market, resource, time, and cost analysis. Circle-Spoke Diagrams are successfully used in presentations, conferences, management documents, magazines, reportages, reviews, reports, TV, and social media.
Flowcharting Software

Types of Flowcharts


HelpDesk
How to Add a Block Diagram to a PowerPoint Presentation

Entity Relationship Diagram - ERD - Software for Design Crows Foot ER Diagrams
_Win_Mac.png "Entity Relationship Diagram Software, Design Elements - Crows Foot (Windows, Macintosh)")

Technical Flow Chart


Process Flow Chart Symbols

Flow Chart Creator

Best Diagramming


Process Flow Chart Symbol

- Arrow circle chart - Template | Circular Flow Diagram Template ...
- Program assessment plan - Arrow circle diagram | Strategic ...
- Pie Chart Examples and Templates | Pie Charts | Arrow circle chart ...
- Grant life cycle - Arrow ring diagram | Lifecycle of an award - Circle ...
- Circle Diagrams | Research cycle - Circle diagram | Lifecycle of an ...
- How to Draw a Circular Arrows Diagram Using ConceptDraw PRO ...
- Ladder of customer loyalty diagram | Loyalty - Arrow circle diagram ...
- Research cycle - Circle diagram | Innovation life cycle - Arrow loop ...
- 2 Arrow Circle Flow Icon Png
- Circular Flow Diagram Template | Circular Arrows | Pyramid ...
- Circular Arrows Diagrams | Fishbone Diagram | DFD Library ...
- Target and Circular Diagrams | Circular Arrows Diagrams ...
- Circle Arrow Scrum
- Free Arrows In Circle Clip Art Png
- Circular Arrows Diagrams | Fishbone Diagram | Pyramid Charts ...
- Circular Flow Diagram Template | Circular Diagram | Circle ...
- Circular Arrows | Circular diagrams - Vector stencils library | DFD ...
- Circular Arrows Diagrams | Circular diagrams - Vector stencils ...
- Circle -Spoke Diagrams
- Circle Arrow Cycle Clipart