Authority Matrix Diagram Software
You need to draw Authority Matrix Diagram quick and easy? Design it with ConceptDraw DIAGRAM!ConceptDraw DIAGRAM extended with Seven Management and Planning Tools solution from the Management Area is the best Authority Matrix Diagram Software.
PROBLEM ANALYSIS. Root Cause Analysis Tree Diagram
Root Cause Analysis Tree Diagram. Use the Root Cause Diagram to perform visual root cause analysis. Root Cause Analysis Tree Diagram is constructed separately for each highly prioritized factor. The goal of this is to find the root causes for the factor and list possible corrective action.ConceptDraw Office suite is a software for problem analysis.
Growth-Share Matrix Software
Growth-Share Matrix Software - ConceptDraw DIAGRAM is a powerful diagramming and vector drawing software for creating professional looking Growth–Share Matrices. For simple and quick creating the Growth–Share Matrix ConceptDraw DIAGRAM offers the Matrices Solution from the Marketing Area of ConceptDraw Solution Park.The Matrices Solution also provides a wide variety of templates and samples that will help you to create the Matrix diagrams of any difficulty.
Flowchart Software
To design the professional looking Flowchart Diagrams use ConceptDraw DIAGRAM diagramming and vector drawing software extended with Flowchart maker solutions from the Diagrams area of ConceptDraw Solution Park.The Flowcharts diagrams are widely used for designing, documenting, analyzing and managing the complex processes and programs in various fields such as business, engineering, architecture, science, manufacturing, administration, etc.
Marketing Analysis Diagram
An example of marketing analysis diagram, can be used to analyse product market and define marketing strategy.Business Tools Perceptual Mapping
This sample shows the Perceptual map. It was created in ConceptDraw DIAGRAM diagramming and vector drawing software using the Matrices Solution from the Marketing area of ConceptDraw Solution Park.Perception Mapping helps organizations measure and transform all aspects of their business, people and culture. Perception Mapping allows to represent the complex relationships graphically, helps identify potential problems of the organization and make the best decisions.
Mind Maps for Business - SWOT Analysis
ConceptDraw SWOT analysis software is a strategic planning method used to evaluate the Strengths, Weaknesses, Opportunities, and Threats facing a project or business.House of Quality Matrix Software
House of Quality Matrix Software - Use the predesigned objects from the Involvement Matrix Objects Library from the Seven Management and Planning Tools Solution to create professional looking House of Quality Matrices in minutes.Mac Tools - SWOT Analysis
The ConceptDraw DIAGRAM provides Mac Tools for drawing SWOT Analysis diagrams.Positioning Map
ConceptDraw DIAGRAM is a powerful diagramming and vector drawing software. Extended with Matrices Solution from the Marketing Area of ConceptDraw Solution Park it became the best software for quick and easy designing various types of Matrix Diagrams, including Positioning Map.BCG Matrix
The growth–share matrix (BCG Matrix) was created by Bruce D. Henderson for the Boston Consulting Group in 1970 to help corporations to analyze their business units and to help the company allocate resources. How is it easy design the BCG Matrices in ConceptDraw DIAGRAM diagramming and vector drawing software supplied with unique Matrices Solution from the Marketing Area of ConceptDraw Solution Park.
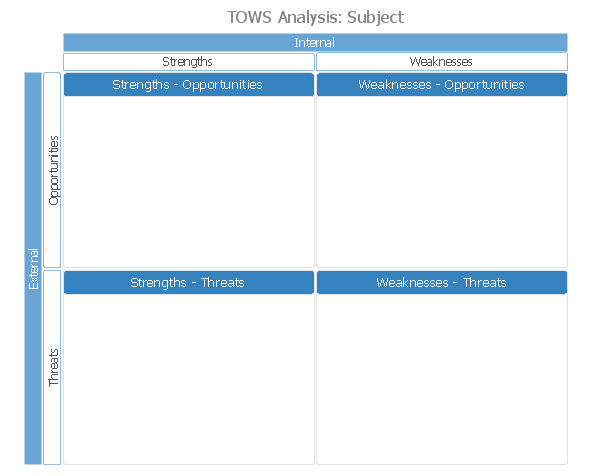
TOWS Analysis Software
TOWS analysis is a method of strategic analysis which is oriented on the study of the threats (T) which are danger for the company and new opportunities (O) which are closely connected with weaknesses (W) and strengths (S) sides of its activity.ConceptDraw DIAGRAM diagramming and vector drawing software extended with SWOT and TOWS Matrix Diagrams Solution from the Management Area is the best for realization TOWS analysis and for quick and easy construction TOWS Matrix.
Relative Value Chart Software
Relative value is a value measured in the terms of liquidity, risks, return of one investment or financial instrument relative to another.Relative values are widely used in:business, economics, investment, management, marketing, statistics, etc.
ConceptDraw DIAGRAM software is the best for drawing professional looking Relative Value Charts. ConceptDraw DIAGRAM provides Divided Bar Diagrams solution from the Graphs and Charts Area of ConceptDraw Solution Park.
ConceptDraw Solution Park
ConceptDraw Solution Park collects graphic extensions, examples and learning materials
Feature Comparison Chart Software
An example of marketing analysis diagram, can be used to analyse product market and define marketing strategy.This sample shows the Feature Comparison Chart of the digital scouting cameras. It can be useful for digital cameras production field, marketing, sales, etc.
- Image Of Maping Diagram Of Elements Of Matrix
- Bubble Diagrams | Bubble Map Maker | SWOT and TOWS Matrix ...
- SWOT and TOWS Matrix Diagrams | SWOT Template | TOWS ...
- Swot Analysis Examples | SWOT Analysis | SWOT and TOWS Matrix ...
- Example Image Of The Diagram Of The Exchange Process Of Market
- Swot Analysis Image Telecommunication
- Quality Function Deployment Diagram Hd Images
- Picture Graph | Basic Diagramming | Growth-Share Matrix Software ...
- Comparison Dashboard | SWOT Sample in Computers | Matrices ...
- Software for Creating SWOT Analysis Diagrams | Mind Maps for ...
- Porter's value chain matrix diagram
- Picture Graphs | Matrices | Line Graphs | Growth And Maintenance ...
- Value Stream Mapping | Fishbone Diagram | Metro Map | Image ...
- Swot Image
- SWOT Analysis Solution - Strategy Tools | TOWS analysis matrix ...
- PROBLEM ANALYSIS. Root Cause Analysis Tree Diagram | Coad ...
- Fishbone Diagram | Fishbone Diagrams | ConceptDraw Solution ...
- How to Create a Picture Graph in ConceptDraw PRO | Picture ...
- Feature Comparison Chart Software | Competitive feature ...
- Line Graphs | Picture Graphs | People | Images Graphs On Growth ...
- ERD | Entity Relationship Diagrams, ERD Software for Mac and Win
- Flowchart | Basic Flowchart Symbols and Meaning
- Flowchart | Flowchart Design - Symbols, Shapes, Stencils and Icons
- Flowchart | Flow Chart Symbols
- Electrical | Electrical Drawing - Wiring and Circuits Schematics
- Flowchart | Common Flowchart Symbols