Best Diagramming


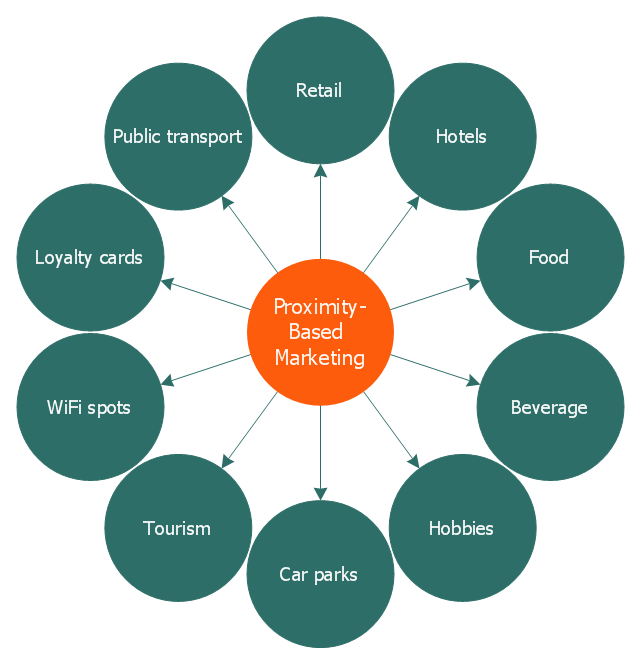
This circle-spoke diagram sample illustrates the proximity marketing.
"Proximity marketing is the localized wireless distribution of advertising content associated with a particular place. Transmissions can be received by individuals in that location who wish to receive them and have the necessary equipment to do so.
Distribution may be via a traditional localized broadcast, or more commonly is specifically targeted to devices known to be in a particular area.
The location of a device may be determined by:
(1) A cellular phone being in a particular cell.
(2) A Bluetooth or WiFi device being within range of a transmitter.
(3) An Internet enabled device with GPS enabling it to request localized content from Internet servers.
(4) A NFC enabled phone can read a RFID chip on a product or media and launch localized content from internet servers.
Communications may be further targeted to specific groups within a given location, for example content in tourist hot spots may only be distributed to devices registered outside the local area.
Communications may be both time and place specific, e.g. content at a conference venue may depend on the event in progress.
Uses of proximity marketing include distribution of media at concerts, information (weblinks on local facilities), gaming and social applications, and advertising." [Proximity marketing. Wikipedia]
The hub-and-spoke diagram example "Proximity based marketing" was created using the ConceptDraw PRO diagramming and vector drawing software extended with the Circle-Spoke Diagrams solution from the area "What is a Diagram" of ConceptDraw Solution Park.
Circle-spoke diagram
Circle Spoke Diagram Template

How To Create a Workflow Diagram

Scatter Graph

Electrical Symbols — Switches and Relays

Competitor Analysis

Geo Map - Europe - Serbia

Electrical Symbols — Rotating Equipment

Blank Scatter Plot

- Proximity Chart Ideas
- Proximity Chart For School
- Proximity Chart Architectural Template Excel
- Proximity Chart
- Best Diagramming | Proximity based marketing | Near-me area ...
- Proximity Chart In Architecture
- Proximity Diagram
- Proximity based marketing | Data Flow Diagrams (DFD) | Venn ...
- Business Package for Management | Proximity Chart Of Bubble ...
- Block diagram - Marketing targeting | Proximity based marketing ...